

Question: Help me solve this problem. The questions are down below. Find the values for the level strategy chart below and the total cost. Paste B
Help me solve this problem. The questions are down below. Find the values for the level strategy chart below and the total cost.
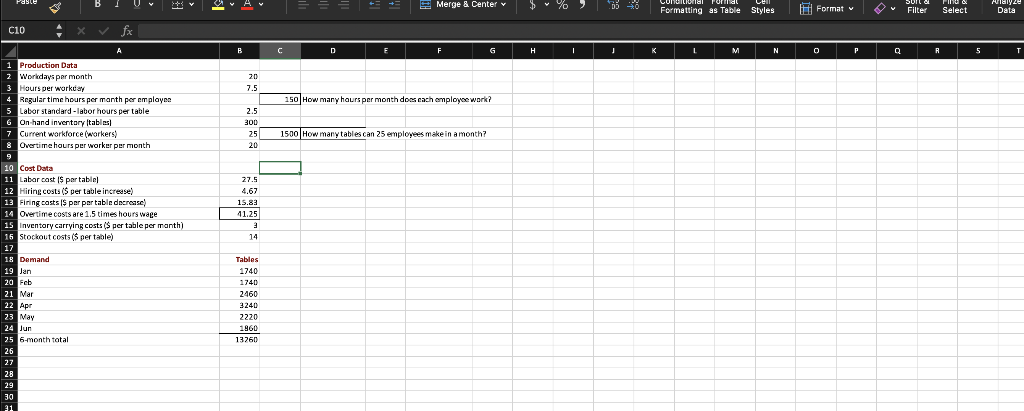
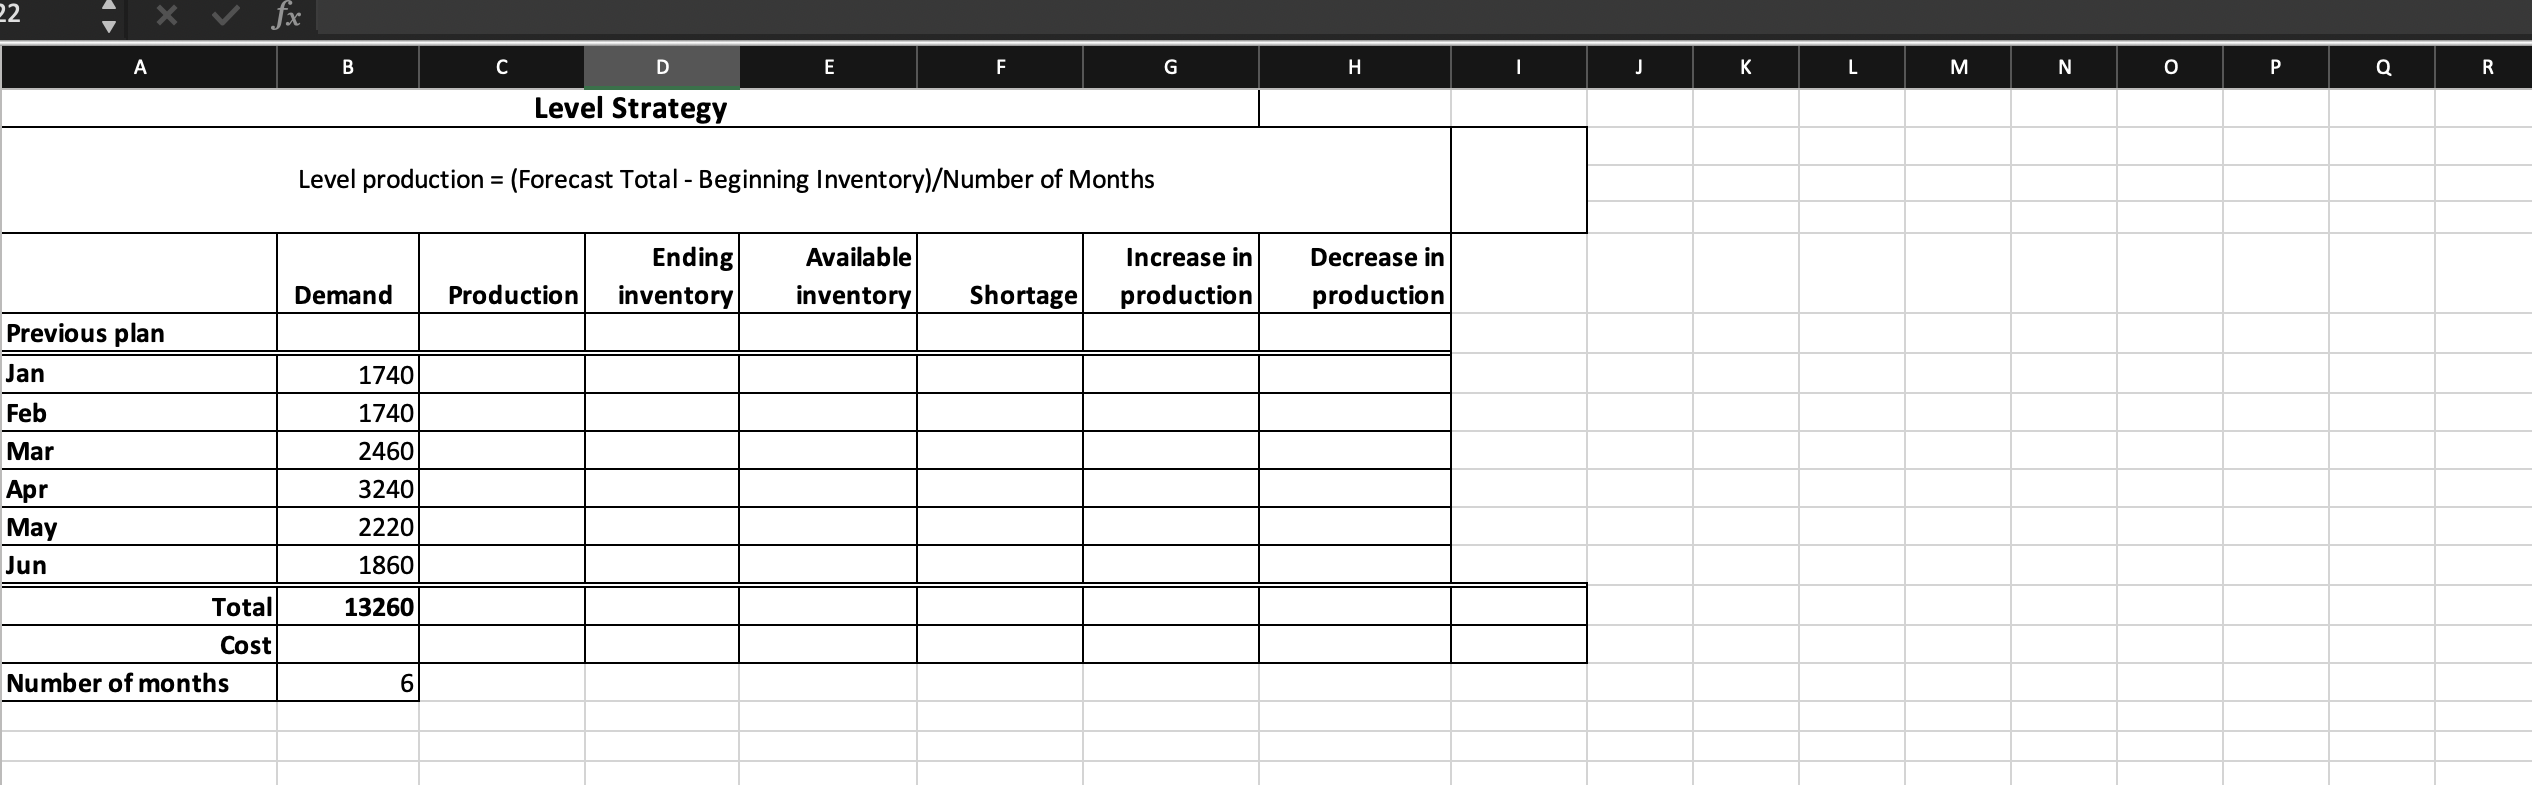
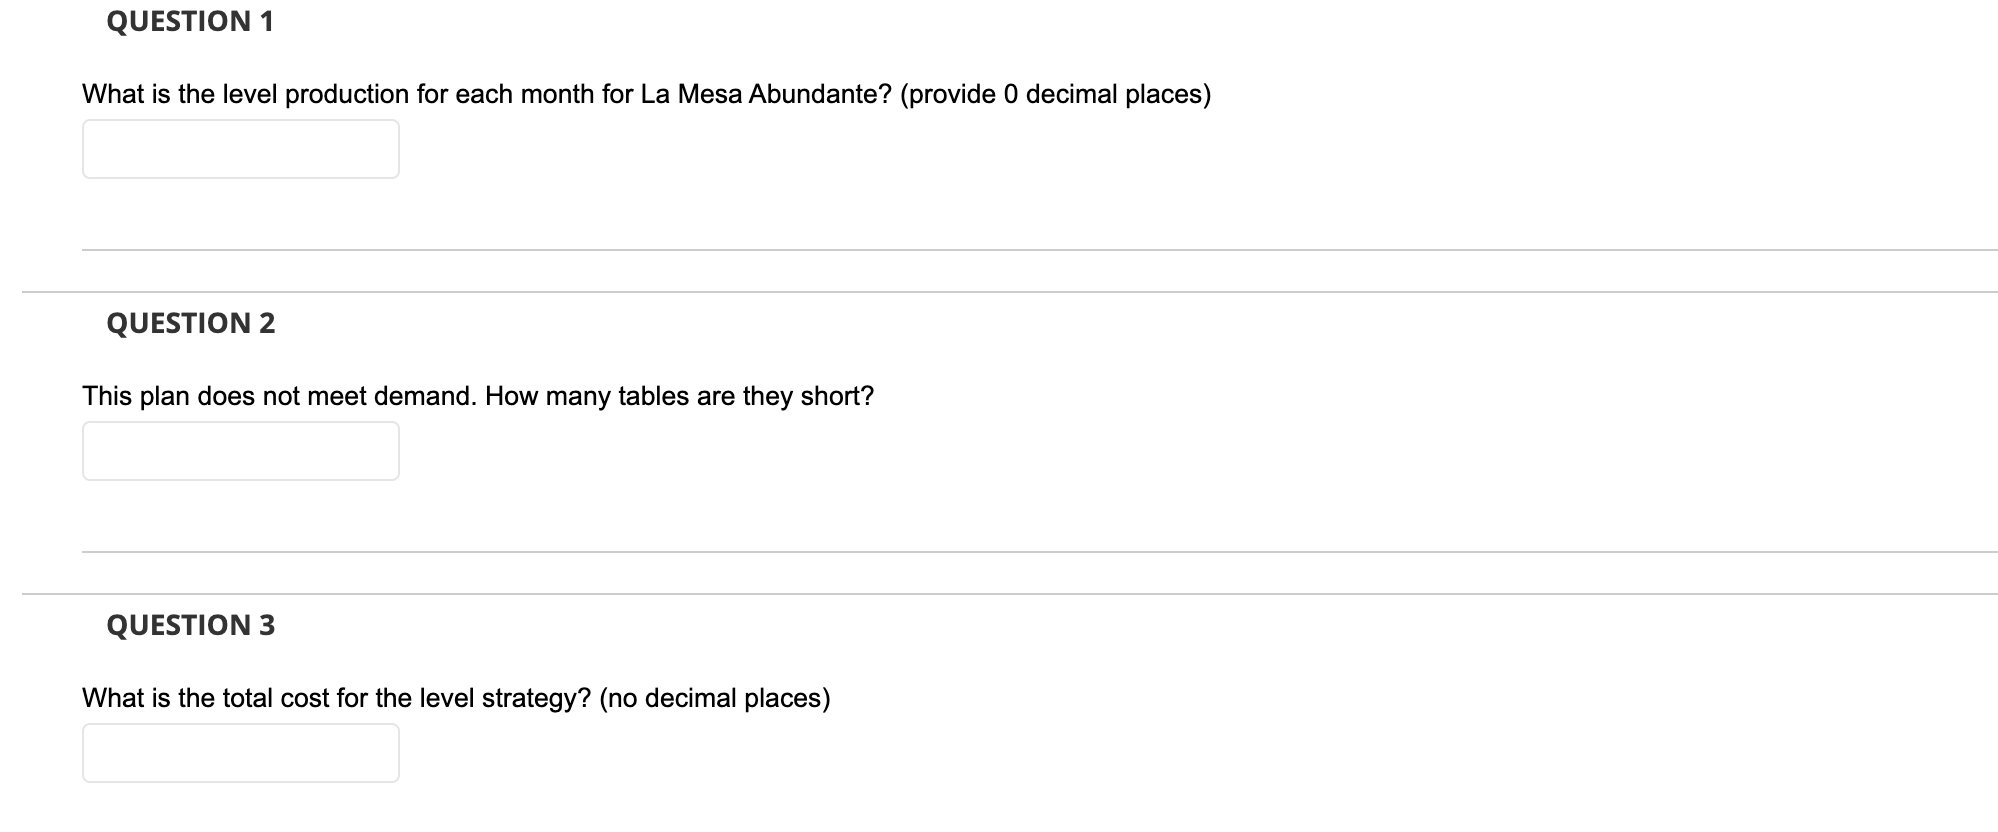
Paste B E Merge & Center v % 038 cond Formal Formatting as Table Styles IF Format SOIL Filter Finc Select Ralyze Data C10 fx B C E F G I J K L M N 0 P Q R 5 5 T 20 7.5 150 How many hours per month does cach employee work? 1 Production Data 2 Workdays per month 3 Hours per workday Regular timc hours per month per cm playen 5 Labor standard-labor hours per table 6 On-hand inventory Itables 7 Current workforce (workers 8 Overtime hours per worker per month 2.5 300 25 20 1500 How many tables can 25 employees make in a month? 27.5 4.67 15.83 41.25 3 14 10 Cost Data 11 Labar cast is partable 12 Hiring costs ($ per table increase 13 Firing casts Is per partable decrease 14 Overtime costs are 1.5 times hours wace 15 Inventory carrying costs (sportable per manth) 15 Stockout costs ($ per table) 17 18 Demand 19 Jan 20 Feb 21 Mar 22 Apr 23 May 24 Jun 25 6-month total 6 26 27 28 29 30 21 Tables 1740 1740 2460 3240 2220 1960 13260 22 x fx A B C D E F G H I J L M N O P Q R Level Strategy Level production = (Forecast Total - Beginning Inventory)/Number of Months = Ending inventory Available inventory Increase in production Decrease in production Demand Production Shortage Previous plan Jan 1740 Feb 1740 2460 3240 Mar Apr May Jun 2220 1860 13260 Total Cost Number of months 6 QUESTION 1 What is the level production for each month for La Mesa Abundante? (provide 0 decimal places) QUESTION 2 This plan does not meet demand. How many tables are they short? QUESTION 3 What is the total cost for the level strategy? (no decimal places) Paste B E Merge & Center v % 038 cond Formal Formatting as Table Styles IF Format SOIL Filter Finc Select Ralyze Data C10 fx B C E F G I J K L M N 0 P Q R 5 5 T 20 7.5 150 How many hours per month does cach employee work? 1 Production Data 2 Workdays per month 3 Hours per workday Regular timc hours per month per cm playen 5 Labor standard-labor hours per table 6 On-hand inventory Itables 7 Current workforce (workers 8 Overtime hours per worker per month 2.5 300 25 20 1500 How many tables can 25 employees make in a month? 27.5 4.67 15.83 41.25 3 14 10 Cost Data 11 Labar cast is partable 12 Hiring costs ($ per table increase 13 Firing casts Is per partable decrease 14 Overtime costs are 1.5 times hours wace 15 Inventory carrying costs (sportable per manth) 15 Stockout costs ($ per table) 17 18 Demand 19 Jan 20 Feb 21 Mar 22 Apr 23 May 24 Jun 25 6-month total 6 26 27 28 29 30 21 Tables 1740 1740 2460 3240 2220 1960 13260 22 x fx A B C D E F G H I J L M N O P Q R Level Strategy Level production = (Forecast Total - Beginning Inventory)/Number of Months = Ending inventory Available inventory Increase in production Decrease in production Demand Production Shortage Previous plan Jan 1740 Feb 1740 2460 3240 Mar Apr May Jun 2220 1860 13260 Total Cost Number of months 6 QUESTION 1 What is the level production for each month for La Mesa Abundante? (provide 0 decimal places) QUESTION 2 This plan does not meet demand. How many tables are they short? QUESTION 3 What is the total cost for the level strategy? (no decimal places)
Step by Step Solution
There are 3 Steps involved in it

Get step-by-step solutions from verified subject matter experts