

Question: Help me to answer the following given below, Statistics and Probability Tutorsss... I. Directions: Complete the following statements. 1. . The most used levels of
Help me to answer the following given below, Statistics and Probability Tutorsss...
I.
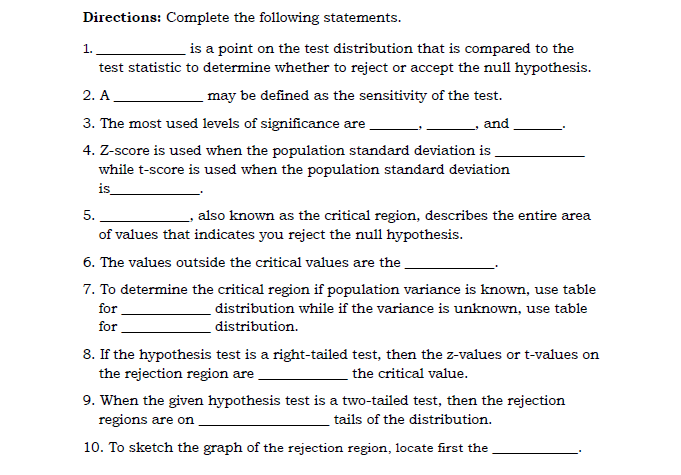
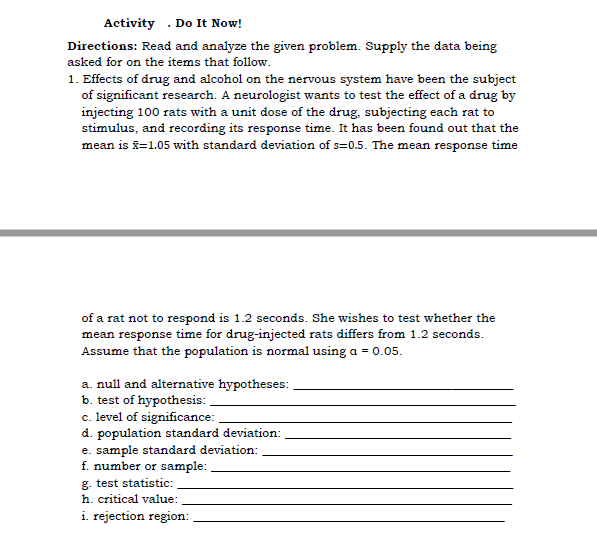
Directions: Complete the following statements. 1. . The most used levels of signicance are is a point on the test distribulion that is compared to the test stalistic to determine whether to reject or accept the null hypothesis. . A may be dened as the sensitivity of the test. and !' . Zscore is used when the population standard deviation is while tscore is used when the population standard deviation is . also known as the critical region, describes the entire area of values that indicates you reject the null hypothesis. . The values outside the critical values are the . To determine the critical region i_f population variance is known, use table for distribution while if the variance is unknown. use table for distribution. . Ifthe hypothesis test is a righttailed test, then the zvalues or tvalues on the rejeclion region are the critical value. 9. When the g'ven hypothesis test is a twotailed test, then the rejeclion regions are on tails of the distribution. ID. To sketch the graph of the rejection region, locate rst the Activity . Do It Now! Directions: Read and analyze the given problem. Supply the data being asked for on the items that follow. 1. Effects of drug and alcohol on the nervous system have been the subject of significant research. A neurologist wants to test the effect of a drug by injecting 100 rats with a unit dose of the drug, subjecting each rat to stimulus, and recording its response time. It has been found out that the mean is *=1.05 with standard deviation of s=0.5. The mean response time of a rat not to respond is 1.2 seconds. She wishes to test whether the mean response time for drug-injected rats differs from 1.2 seconds. Assume that the population is normal using a = 0.05. a. null and alternative hypotheses: b. test of hypothesis: c. level of significance: d. population standard deviation: e. sample standard deviation: f. number or sample: g. test statistic: h. critical value: i. rejection region
Step by Step Solution
There are 3 Steps involved in it

Get step-by-step solutions from verified subject matter experts