Question: Help me understand ..This question is complete The relevant Treasury spot curve (expressed as bond equivalent yields) is as follows: Time to Maturity (months) SPOT
Help me understand ..This question is complete
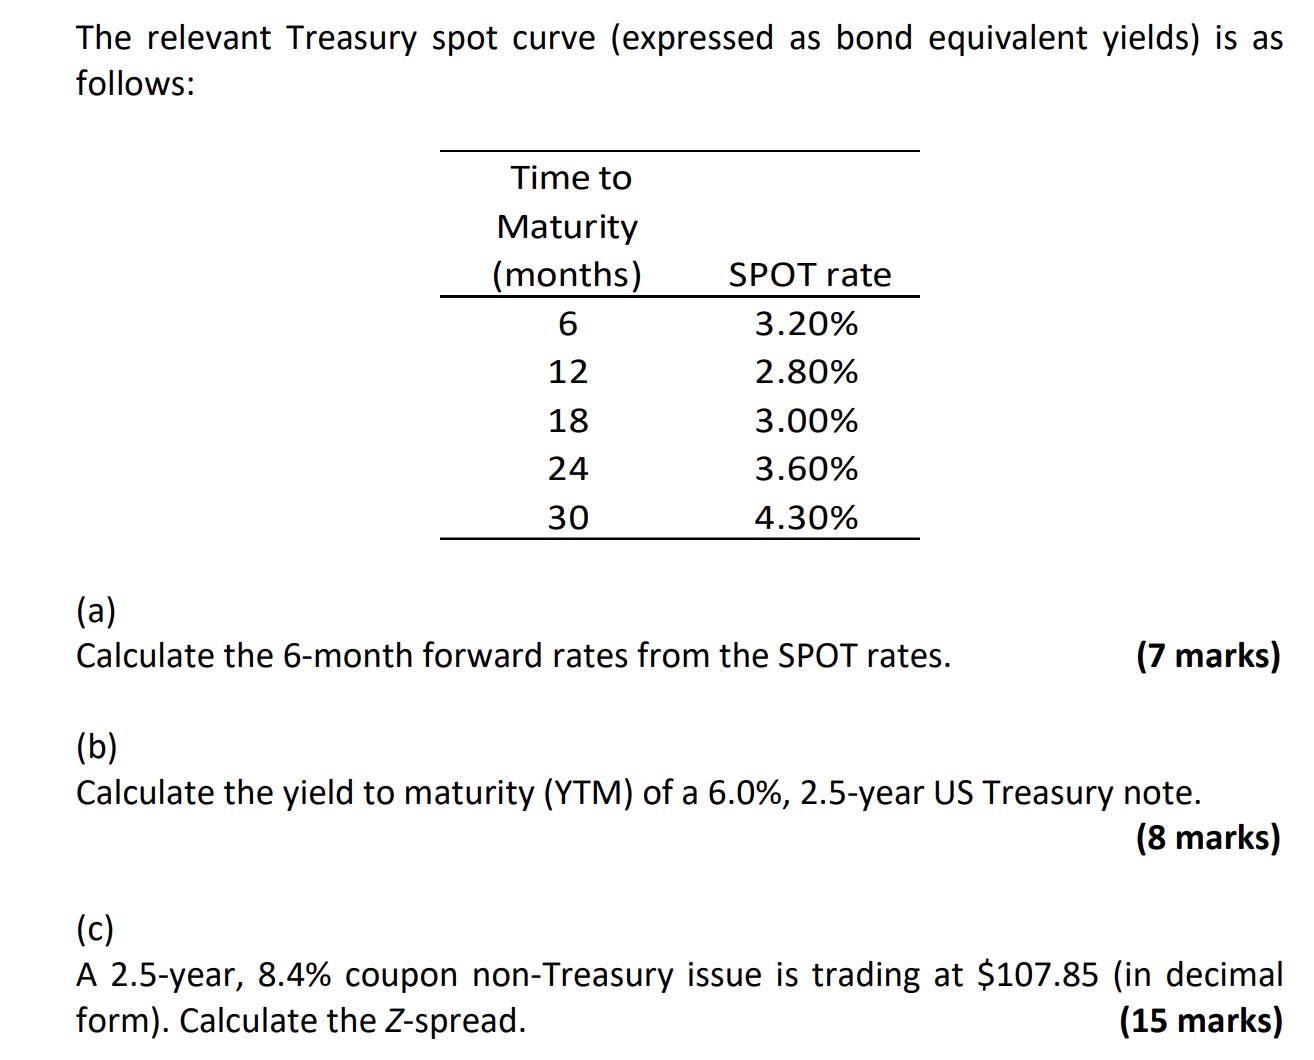
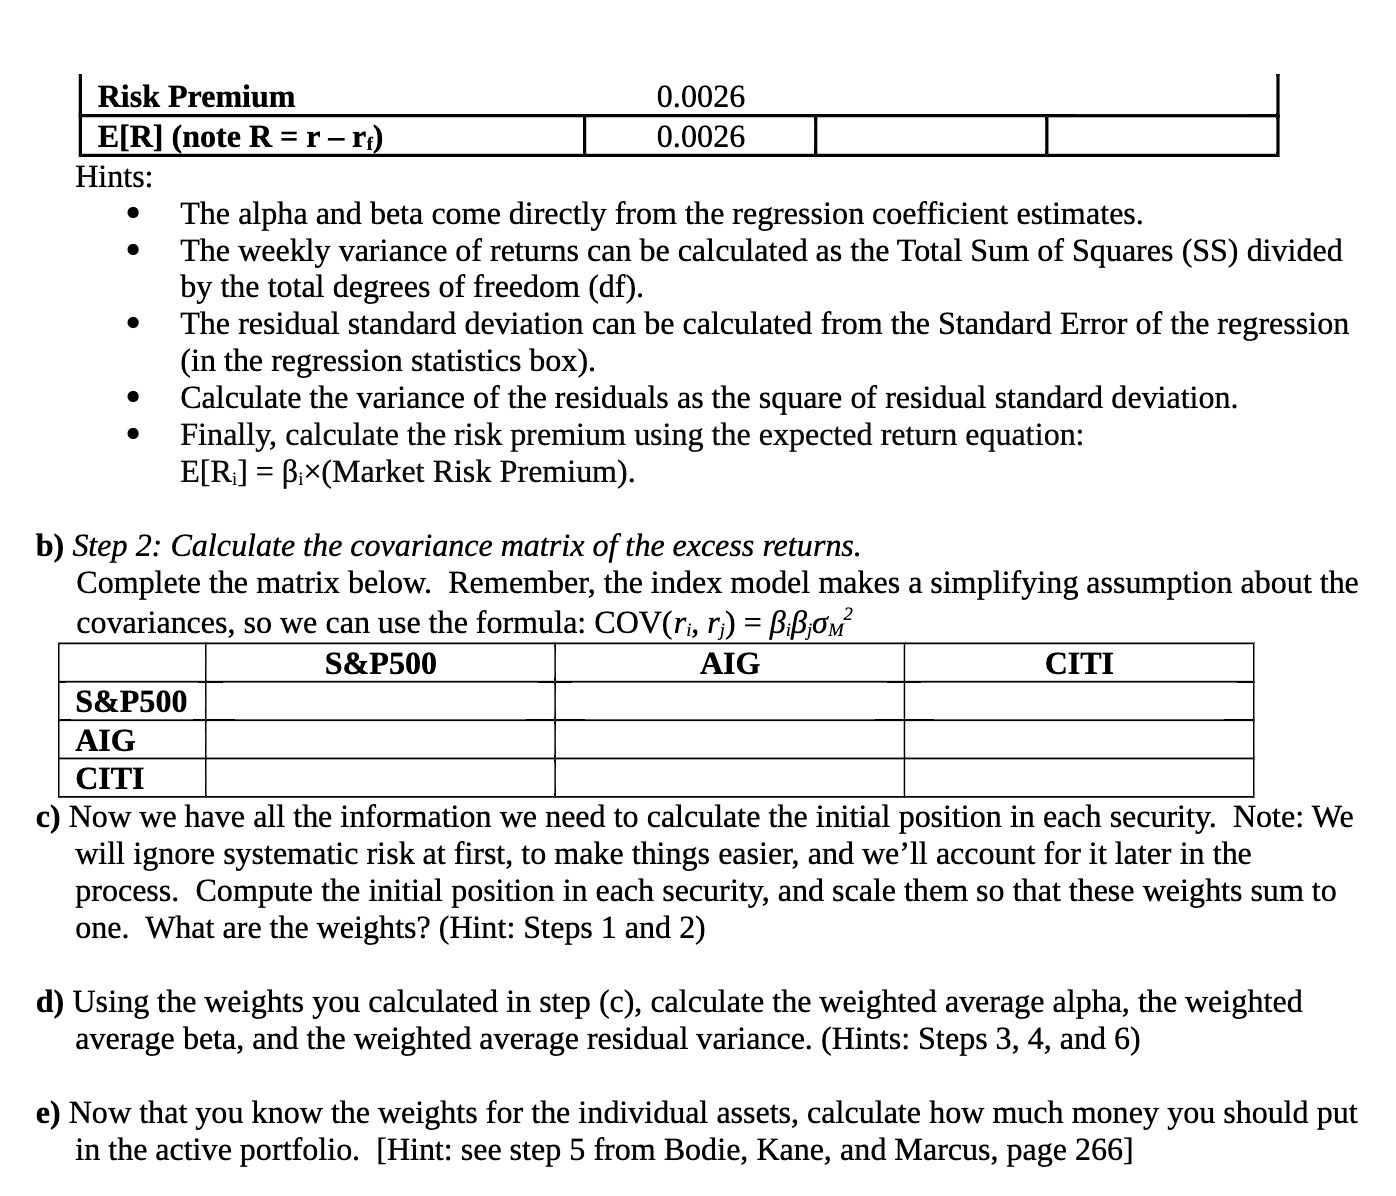
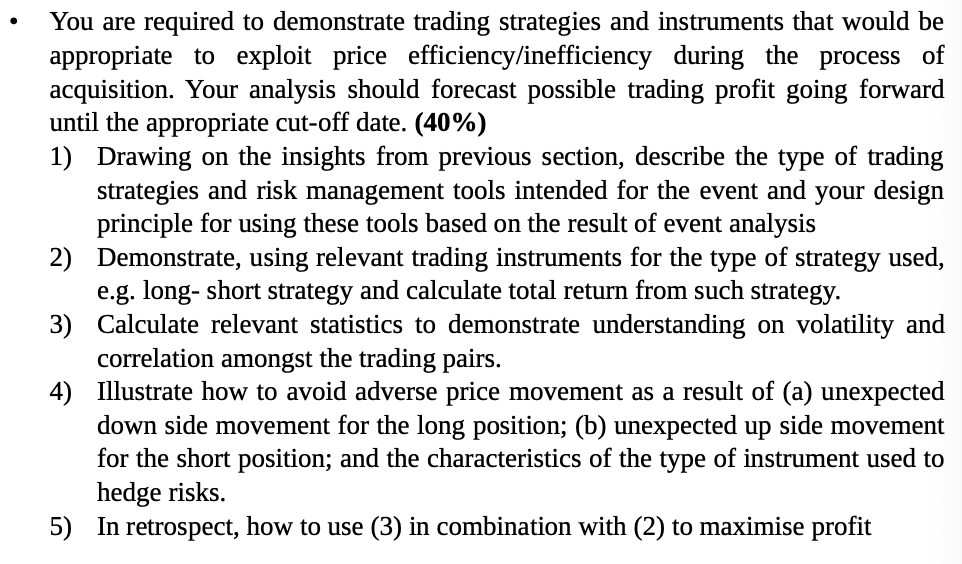
The relevant Treasury spot curve (expressed as bond equivalent yields) is as follows: Time to Maturity (months) SPOT rate 6 3.20% 12 2.80% 18 3.00% 24 3.60% 30 4.30% (6!) Calculate the 6-month forward rates from the SPOT rates. (7 marks) (b) Calculate the yield to maturity (YTM) of a 6.0%, 2.5-year US Treasury note. (8 marks) (C) A 2.5-year, 8.4% coupon non-Treasury issue is trading at $107.85 (in decimal form). Calculate the Zspread. (15 marks) Risk Premium 0.0026 -_ Hints: 0 The alpha and beta come directly from the regression coefficient estimates. 0 The weekly variance of returns can be calculated as the Total Sum of Squares (S S) divided by the total degrees of freedom (df). - The residual standard deviation can be calculated from the Standard Error of the regression (in the regression statistics box). 0 Calculate the variance of the residuals as the square of residual standard deviation. 0 Finally, calculate the risk premium using the expected return equation: HR] = [31X(Market Risk Premium). b) Step 2: Calculate the covariance matrix of the excess returns. Complete the matrix below. Remember, the index model makes a simplifying assumption about the covariances, so we can use the formula: COV(r.-, r,) = BiBjUM2 _ S&P500 S&P500 c) Now we have all the information we need to calculate the initial position in each security. Note: We will ignore systematic risk at first, to make things easier, and we'll account for it later in the process. Compute the initial position in each security, and scale them so that these weights sum to one. What are the weights? (Hint: Steps 1 and 2) d) Using the weights you calculated in step (c), calculate the weighted average alpha, the weighted average beta, and the weighted average residual variance. (Hints: Steps 3, 4, and 6) e) Now that you know the weights for the individual assets, calculate how much money you should put in the active portfolio. [Hint see step 5 from Bodie, Kane, and Marcus, page 266] - You are required to demonstrate trading strategies and instruments that would be appropriate to exploit price efficiency/inefficiency during the process of acquisition. Your analysis should forecast possible trading profit going forward until the appropriate cut-off date. (40%) 1) Drawing on the insights from previous section, describe the type of trading strategies and risk management tools intended for the event and your design principle for using these tools based on the result of event analysis 2) Demonstrate, using relevant trading instruments for the type of strategy used, e.g. long- short strategy and calculate total return from such strategy. 3) Calculate relevant statistics to demonstrate understanding on volatility and correlation amongst the trading pairs. 4) Illustrate how to avoid adverse price movement as a result of (a) unexpected down side movement for the long position; (b) unexpected up side movement for the short position; and the characteristics of the type of instrument used to hedge risks. 5) In retrospect, how to use (3) in combination with (2) to maximise profit