

Question: help me with this matlab code im very lost. 5 - Report using fprintf: The most populous nation in the HIC/UMI/LMI/LI is nation ###, which
 help me with this matlab code im very lost.
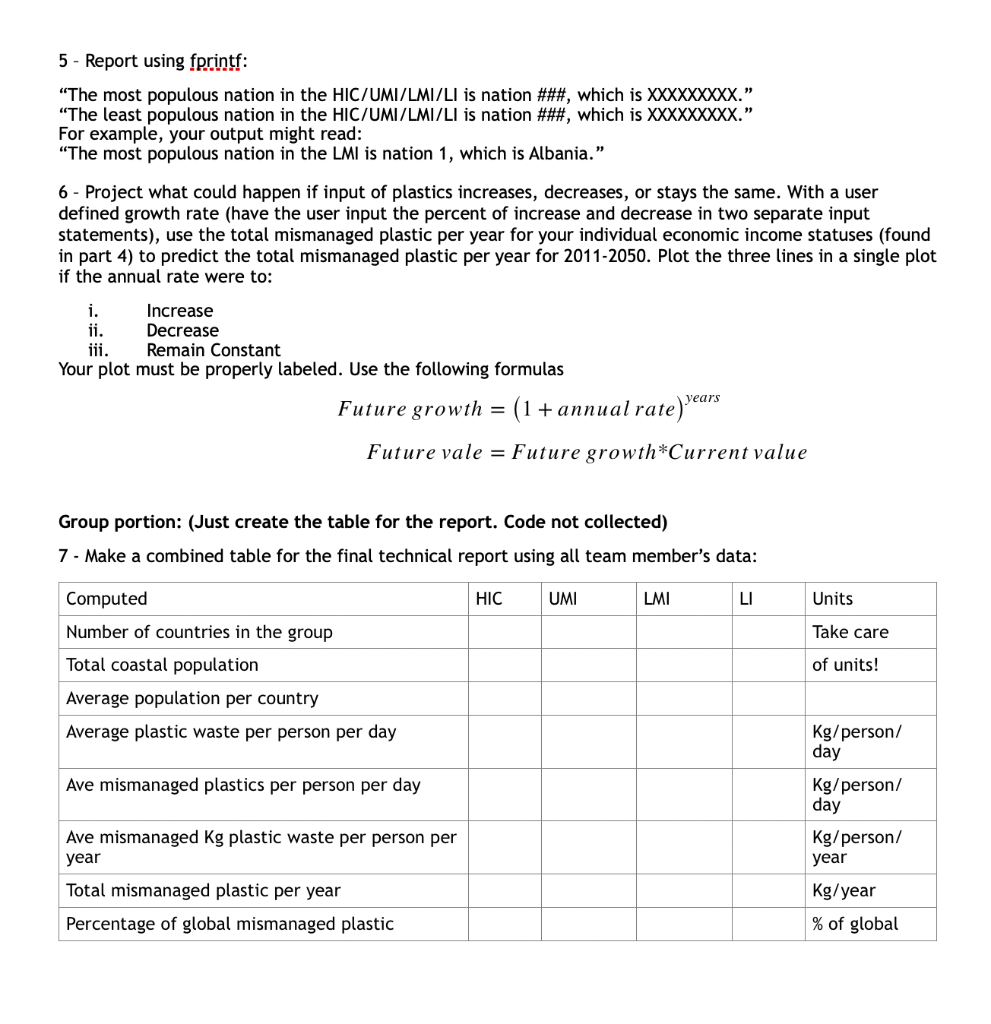
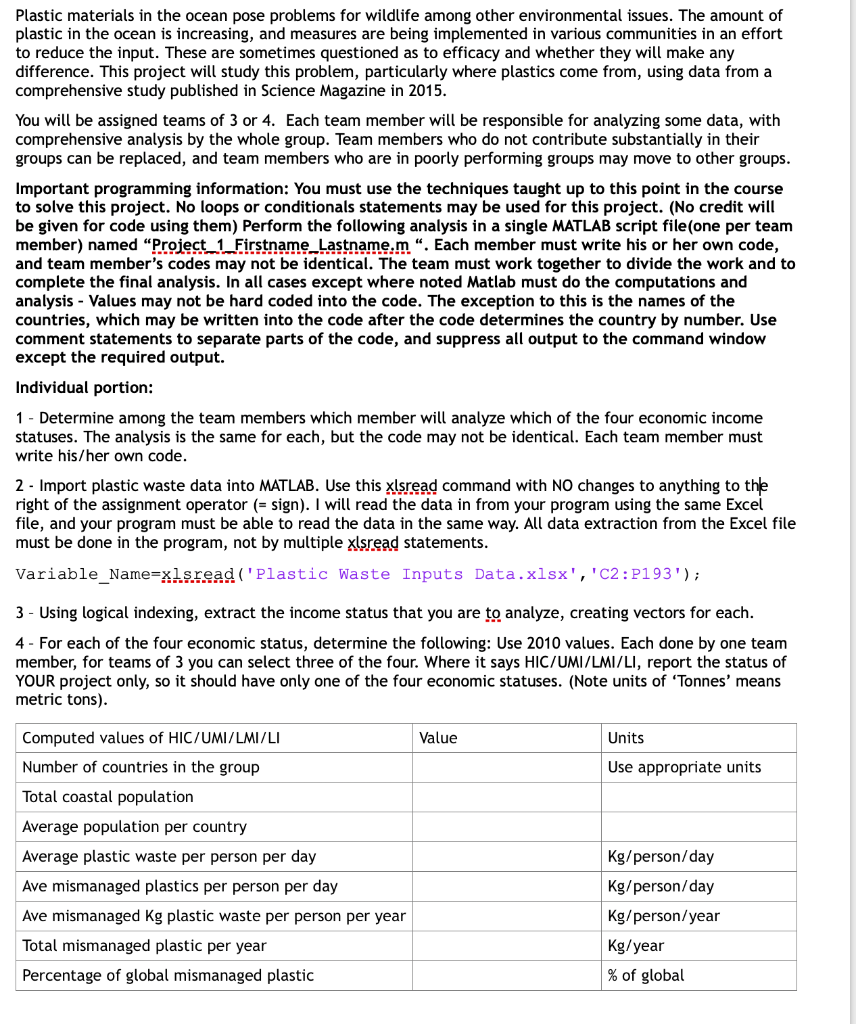
5 - Report using fprintf: "The most populous nation in the HIC/UMI/LMI/LI is nation ###, which is XXXXXXXXX." "The least populous nation in the HIC/UMI/LMI/LI is nation ###, which is XXXXXXXXX." For example, your output might read: "The most populous nation in the LMI is nation 1, which is Albania." 6 - Project what could happen if input of plastics increases, decreases, or stays the same. With a user defined growth rate (have the user input the percent of increase and decrease in two separate input statements), use the total mismanaged plastic per year for your individual economic income statuses (found in part 4) to predict the total mismanaged plastic per year for 2011-2050. Plot the three lines in a single plot if the annual rate were to: i. Increase ii. Decrease iii. Remain Constant Your plot must be properly labeled. Use the following formulas Future growth = (1 + annual rate) Year year's Future vale = Future growth*Current value Group portion: (Just create the table for the report. Code not collected) 7 - Make a combined table for the final technical report using all team member's data: HIC UMI LMI LI Units Take care Computed Number of countries in the group Total coastal population Average population per country Average plastic waste per person per day of units! Kg/person/ day Ave mismanaged plastics per person per day Kg/person/ day Kg/person/ year Ave mismanaged kg plastic waste per person per year Total mismanaged plastic per year Percentage of global mismanaged plastic Kg/year % of global Plastic materials in the ocean pose problems for wildlife among other environmental issues. The amount of plastic in the ocean is increasing, and measures are being implemented in various communities in an effort to reduce the input. These are sometimes questioned as to efficacy and whether they will make any difference. This project will study this problem, particularly where plastics come from, using data from a comprehensive study published in Science Magazine in 2015. You will be assigned teams of 3 or 4. Each team member will be responsible for analyzing some data, with comprehensive analysis by the whole group. Team members who do not contribute substantially in their groups can be replaced, and team members who are in poorly performing groups may move to other groups. Important programming information: You must use the techniques taught up to this point in the course to solve this project. No loops or conditionals statements may be used for this project. (No credit will be given for code using them) Perform the following analysis in a single MATLAB script file (one per team member) named "Project_1_Firstname_Lastname.m". Each member must write his or her own code, and team member's codes may not be identical. The team must work together to divide the work and to complete the final analysis. In all cases except where noted Matlab must do the computations and analysis - Values may not be hard coded into the code. The exception to this is the names of the countries, which may be written into the code after the code determines the country by number. Use comment statements to separate parts of the code, and suppress all output to the command window except the required output. Individual portion: 1 - Determine among the team members which member will analyze which of the four economic income statuses. The analysis is the same for each, but the code may not be identical. Each team member must write his/her own code. 2 - Import plastic waste data into MATLAB. Use this xlsread command with NO changes to anything to the right of the assignment operator (= sign). I will read the data in from your program using the same Excel file, and your program must be able to read the data in the same way. All data extraction from the Excel file must be done in the program, not by multiple xlsread statements. Variable_Name=xlsread('Plastic Waste Inputs Data.xlsx', 'C2:2193'); 3 - Using logical indexing, extract the income status that you are to analyze, creating vectors for each. 4 - For each of the four economic status, determine the following: Use 2010 values. Each done by one team member, for teams of 3 you can select three of the four. Where it says HIC/UMI/LMI/LI, report the status of YOUR project only, so it should have only one of the four economic statuses. (Note units of 'Tonnes' means metric tons). Value Units Use appropriate units Computed values of HIC/UMI/LMI/LI Number of countries in the group Total coastal population Average population per country Average plastic waste per person per day Ave mismanaged plastics per person per day Ave mismanaged kg plastic waste per person per year Total mismanaged plastic per year Percentage of global mismanaged plastic Kg/person/day Kg/person/day Kg/person/year Kg/year % of global 5 - Report using fprintf: "The most populous nation in the HIC/UMI/LMI/LI is nation ###, which is XXXXXXXXX." "The least populous nation in the HIC/UMI/LMI/LI is nation ###, which is XXXXXXXXX." For example, your output might read: "The most populous nation in the LMI is nation 1, which is Albania." 6 - Project what could happen if input of plastics increases, decreases, or stays the same. With a user defined growth rate (have the user input the percent of increase and decrease in two separate input statements), use the total mismanaged plastic per year for your individual economic income statuses (found in part 4) to predict the total mismanaged plastic per year for 2011-2050. Plot the three lines in a single plot if the annual rate were to: i. Increase ii. Decrease iii. Remain Constant Your plot must be properly labeled. Use the following formulas Future growth = (1 + annual rate) Year year's Future vale = Future growth*Current value Group portion: (Just create the table for the report. Code not collected) 7 - Make a combined table for the final technical report using all team member's data: HIC UMI LMI LI Units Take care Computed Number of countries in the group Total coastal population Average population per country Average plastic waste per person per day of units! Kg/person/ day Ave mismanaged plastics per person per day Kg/person/ day Kg/person/ year Ave mismanaged kg plastic waste per person per year Total mismanaged plastic per year Percentage of global mismanaged plastic Kg/year % of global Plastic materials in the ocean pose problems for wildlife among other environmental issues. The amount of plastic in the ocean is increasing, and measures are being implemented in various communities in an effort to reduce the input. These are sometimes questioned as to efficacy and whether they will make any difference. This project will study this problem, particularly where plastics come from, using data from a comprehensive study published in Science Magazine in 2015. You will be assigned teams of 3 or 4. Each team member will be responsible for analyzing some data, with comprehensive analysis by the whole group. Team members who do not contribute substantially in their groups can be replaced, and team members who are in poorly performing groups may move to other groups. Important programming information: You must use the techniques taught up to this point in the course to solve this project. No loops or conditionals statements may be used for this project. (No credit will be given for code using them) Perform the following analysis in a single MATLAB script file (one per team member) named "Project_1_Firstname_Lastname.m". Each member must write his or her own code, and team member's codes may not be identical. The team must work together to divide the work and to complete the final analysis. In all cases except where noted Matlab must do the computations and analysis - Values may not be hard coded into the code. The exception to this is the names of the countries, which may be written into the code after the code determines the country by number. Use comment statements to separate parts of the code, and suppress all output to the command window except the required output. Individual portion: 1 - Determine among the team members which member will analyze which of the four economic income statuses. The analysis is the same for each, but the code may not be identical. Each team member must write his/her own code. 2 - Import plastic waste data into MATLAB. Use this xlsread command with NO changes to anything to the right of the assignment operator (= sign). I will read the data in from your program using the same Excel file, and your program must be able to read the data in the same way. All data extraction from the Excel file must be done in the program, not by multiple xlsread statements. Variable_Name=xlsread('Plastic Waste Inputs Data.xlsx', 'C2:2193'); 3 - Using logical indexing, extract the income status that you are to analyze, creating vectors for each. 4 - For each of the four economic status, determine the following: Use 2010 values. Each done by one team member, for teams of 3 you can select three of the four. Where it says HIC/UMI/LMI/LI, report the status of YOUR project only, so it should have only one of the four economic statuses. (Note units of 'Tonnes' means metric tons). Value Units Use appropriate units Computed values of HIC/UMI/LMI/LI Number of countries in the group Total coastal population Average population per country Average plastic waste per person per day Ave mismanaged plastics per person per day Ave mismanaged kg plastic waste per person per year Total mismanaged plastic per year Percentage of global mismanaged plastic Kg/person/day Kg/person/day Kg/person/year Kg/year % of global
Step by Step Solution
There are 3 Steps involved in it

Get step-by-step solutions from verified subject matter experts