

Question: can someone help me with this matlab. asap.. Exercise 1 Plotting the Fourier Transform of Signals In MATLAB, you can find the Fourier Transform of
can someone help me with this matlab. asap..
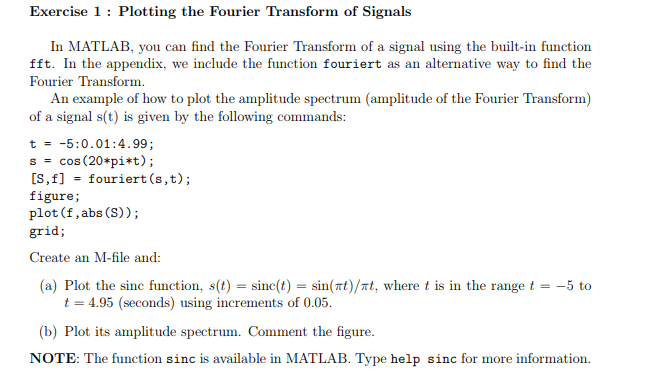
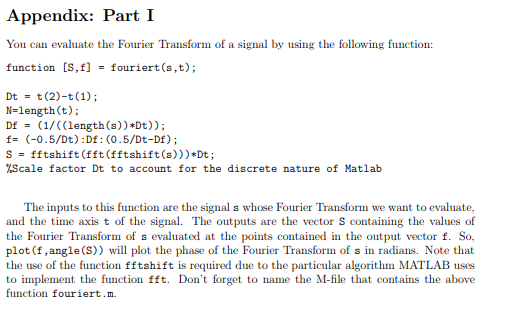
Exercise 1 Plotting the Fourier Transform of Signals In MATLAB, you can find the Fourier Transform of a signal using the built-in function fft. In the appendix, we include the function fouriert as an alternative way to find the Fourier Transform. An example of how to plot the amplitude spectrum (amplitude of the Fourier Transform) of a signal s(t) is given by the following commands: t5:0.01:4.99; s-cos (20 pi*t); [S,f-fouriert (s,t) figure; plot (f,abs (S)); grid; Create an M-file and: (a) Plot the sine function, s(t) = sinc(t) = sin(rt)/rt, where t is in the range t =-5 to t = 4.95 (seconds) using increments of 0.05. (b) Plot its amplitude spectrum. Comment the figure. NOTE: The function sinc is available in MATLAB. Type help sinc for more information. Appendix: Part 1I You can evaluate the Fourier Transform of a signal by using the following function: function Is,ffouriert(s,t) Dt = t(2)-t (1); DE = (1/ ( ( length(s))*DO ); f- (-0.5/Dt) :Df: C0.5/Dt-Df) S-fftshift (fft (fftshift(s)))Dt; %Scale factor Dt to account for the discrete nature of Matlab The inputs to this function are the signal s whose Fourier Transform we want to evaluate, and the time axis t of the signal. The outputs are the vector S containing the values of the Fourier Transform of s evaluated at the points contained in the output vector f. So, plot (f,angle(S)) will plot the phase of the Fourier Transform of s in radians. Note that the use of the function fftshift is required due to the particular algorithm MATLAB uses to implement the function fft. Don't forget to name the M-file that contains the above function fouriert.m Exercise 1 Plotting the Fourier Transform of Signals In MATLAB, you can find the Fourier Transform of a signal using the built-in function fft. In the appendix, we include the function fouriert as an alternative way to find the Fourier Transform. An example of how to plot the amplitude spectrum (amplitude of the Fourier Transform) of a signal s(t) is given by the following commands: t5:0.01:4.99; s-cos (20 pi*t); [S,f-fouriert (s,t) figure; plot (f,abs (S)); grid; Create an M-file and: (a) Plot the sine function, s(t) = sinc(t) = sin(rt)/rt, where t is in the range t =-5 to t = 4.95 (seconds) using increments of 0.05. (b) Plot its amplitude spectrum. Comment the figure. NOTE: The function sinc is available in MATLAB. Type help sinc for more information. Appendix: Part 1I You can evaluate the Fourier Transform of a signal by using the following function: function Is,ffouriert(s,t) Dt = t(2)-t (1); DE = (1/ ( ( length(s))*DO ); f- (-0.5/Dt) :Df: C0.5/Dt-Df) S-fftshift (fft (fftshift(s)))Dt; %Scale factor Dt to account for the discrete nature of Matlab The inputs to this function are the signal s whose Fourier Transform we want to evaluate, and the time axis t of the signal. The outputs are the vector S containing the values of the Fourier Transform of s evaluated at the points contained in the output vector f. So, plot (f,angle(S)) will plot the phase of the Fourier Transform of s in radians. Note that the use of the function fftshift is required due to the particular algorithm MATLAB uses to implement the function fft. Don't forget to name the M-file that contains the above function fouriert.m
Step by Step Solution
There are 3 Steps involved in it
To solve the exercise follow these steps to create the necessary MATLAB scripts Step 1 Create the fo... View full answer

Get step-by-step solutions from verified subject matter experts