

Question: help me with this stat problem D Question 2 2 pts Consider the following cumulative relative frequency graph of the scores of students in an
help me with this stat problem
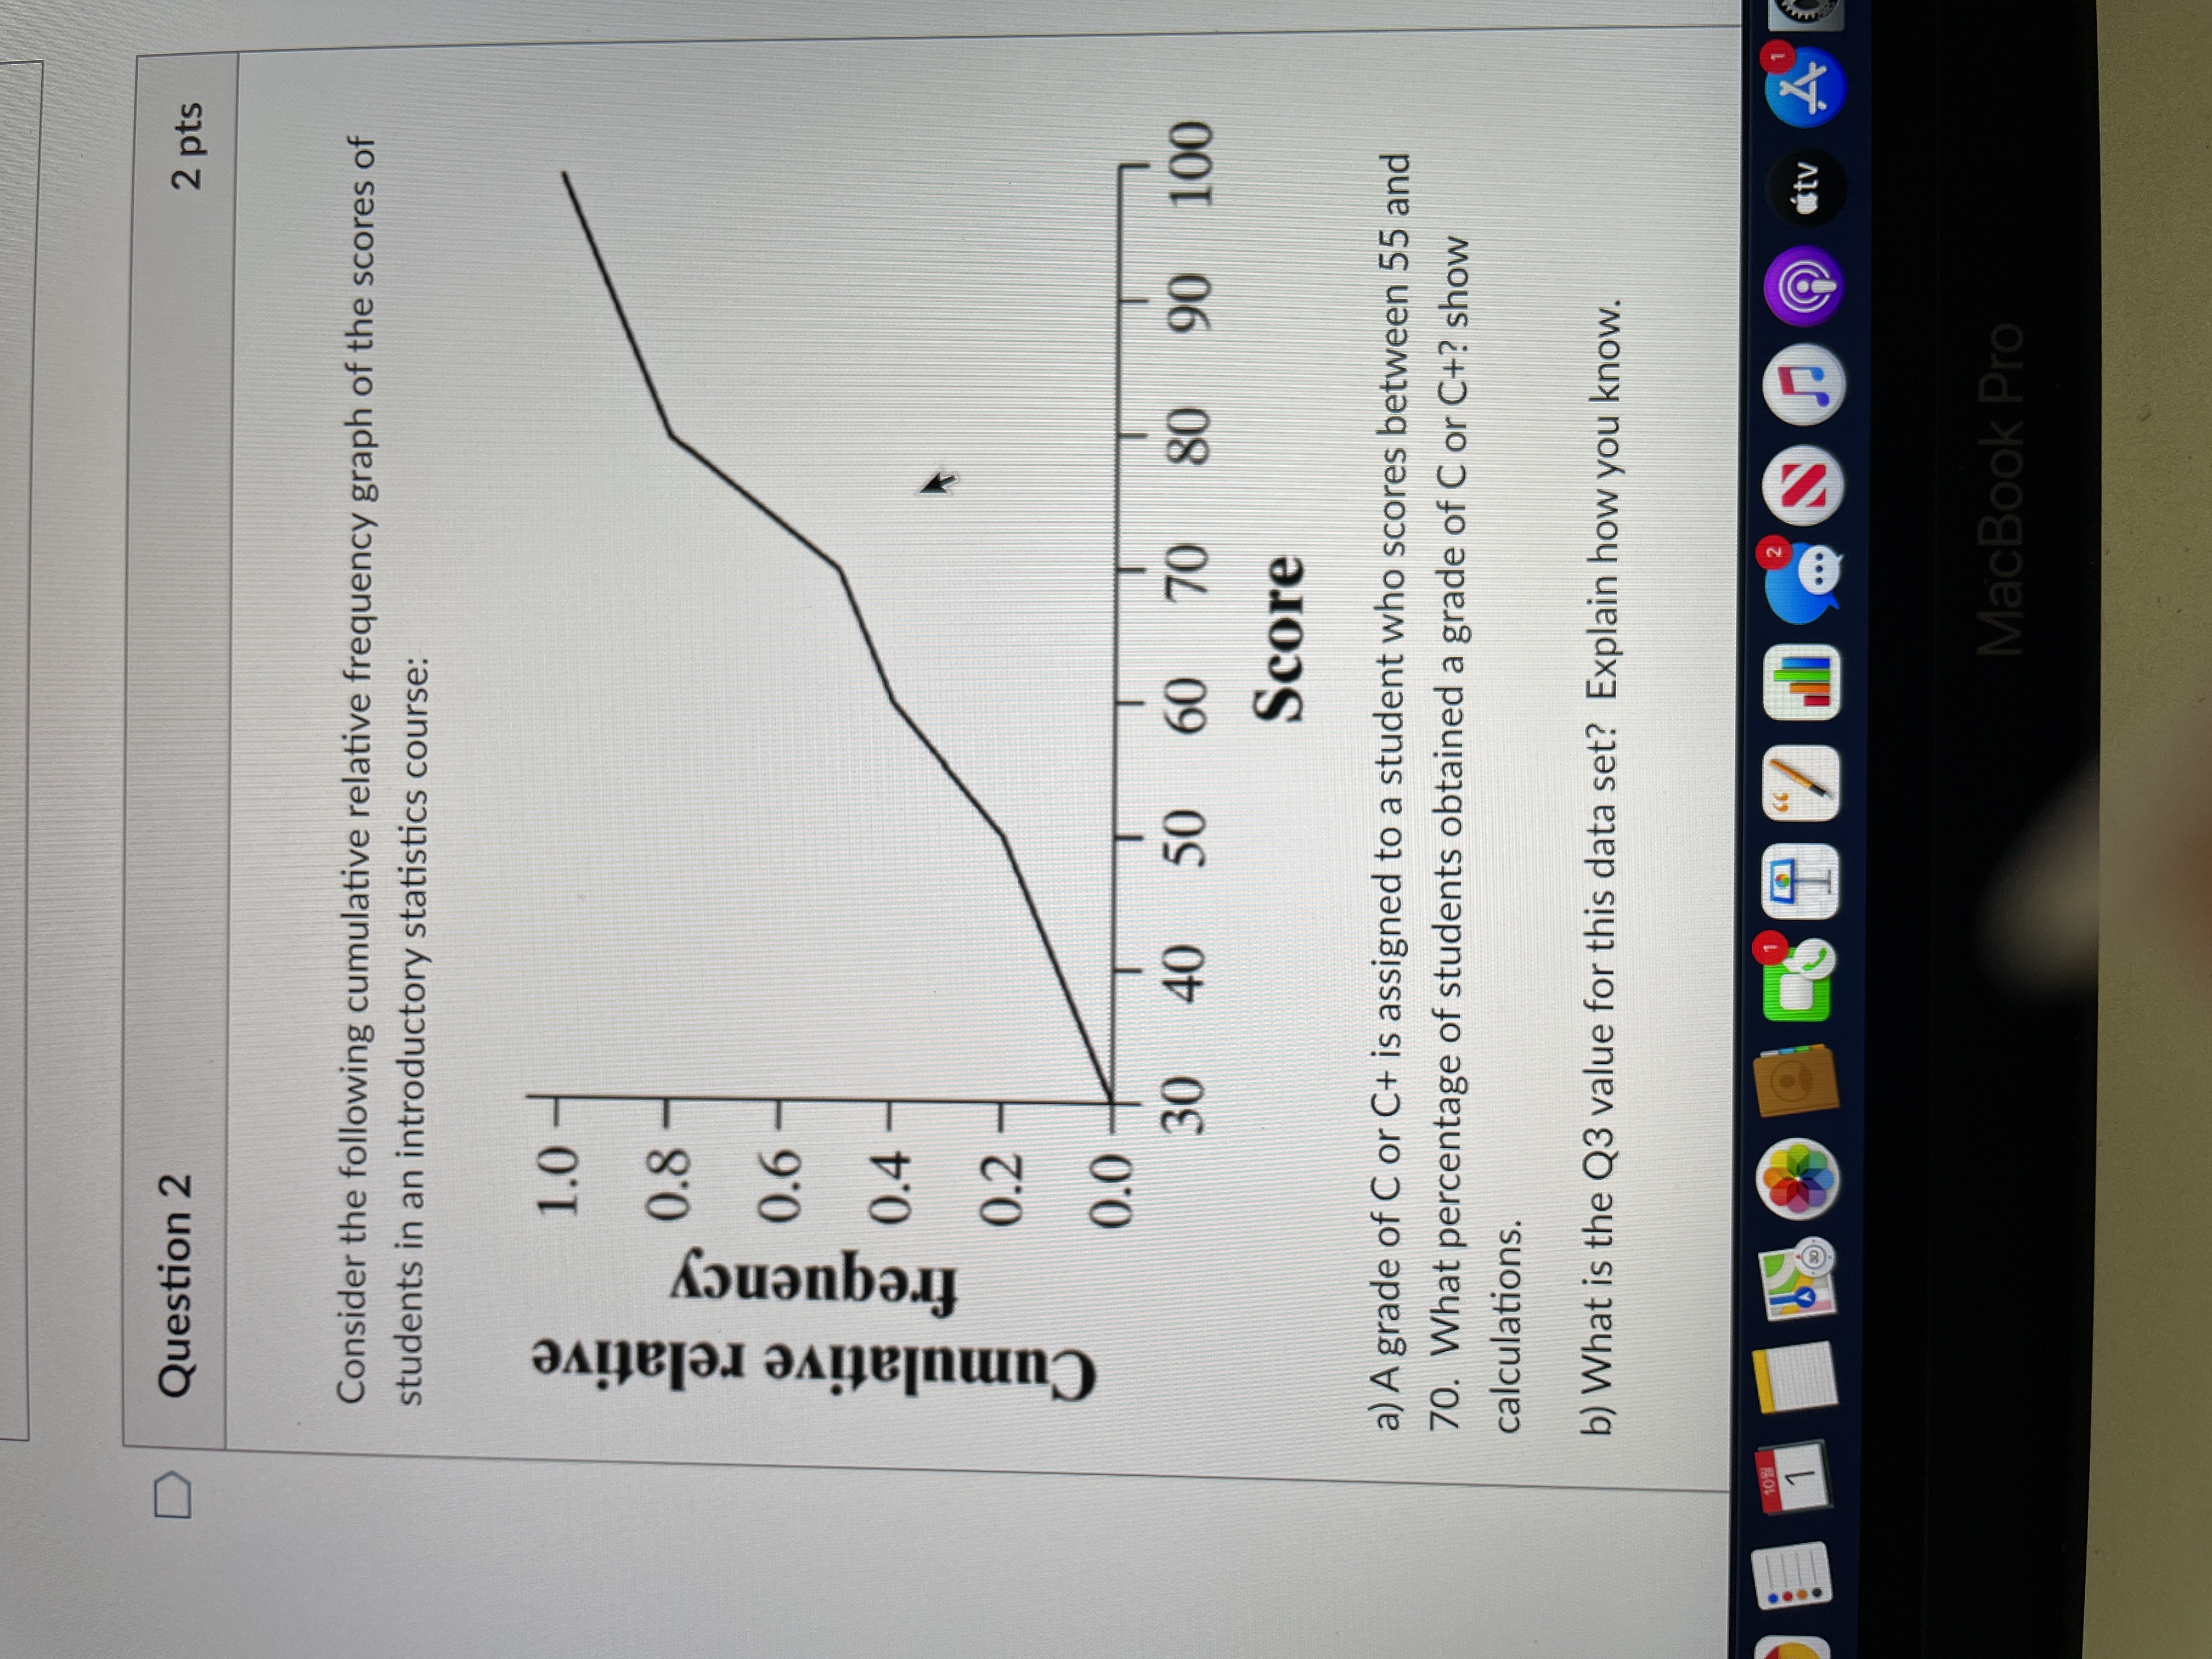
D Question 2 2 pts Consider the following cumulative relative frequency graph of the scores of students in an introductory statistics course: 1.0 0.8 Cumulative relative frequency 8 8 8 0.0 30 40 50 60 70 80 90 100 Score a) A grade of C or C+ is assigned to a student who scores between 55 and 70. What percentage of students obtained a grade of C or C+? show calculations. b) What is the Q3 value for this data set? Explain how you know. 109 tv MacBook Pro
Step by Step Solution
There are 3 Steps involved in it
1 Expert Approved Answer
Step: 1 Unlock

Question Has Been Solved by an Expert!
Get step-by-step solutions from verified subject matter experts
Step: 2 Unlock
Step: 3 Unlock