

Question: Help needed Try It 2.24 The following data set shows the heights in inches for the boys in a class of 40 students. 66; 66;
Help needed
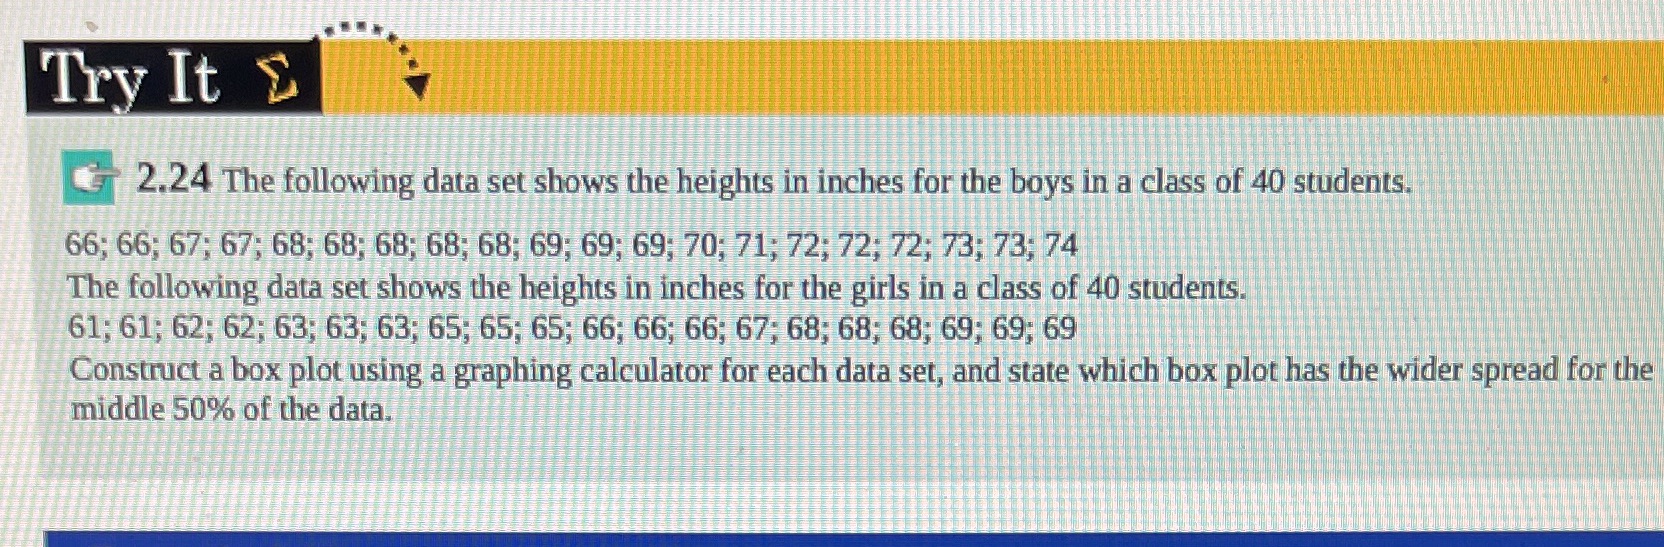
Try It 2.24 The following data set shows the heights in inches for the boys in a class of 40 students. 66; 66; 67; 67; 68; 68; 68; 68; 68; 69; 69; 69; 70; 71; 72; 72; 72; 73; 73; 74 The following data set shows the heights in inches for the girls in a class of 40 students. 61; 61; 62; 62; 63; 63; 63; 65; 65; 65; 66; 66; 66; 67; 68; 68; 68; 69; 69; 69 Construct a box plot using a graphing calculator for each data set, and state which box plot has the wider spread for the middle 50% of the data
Step by Step Solution
There are 3 Steps involved in it
1 Expert Approved Answer
Step: 1 Unlock

Question Has Been Solved by an Expert!
Get step-by-step solutions from verified subject matter experts
Step: 2 Unlock
Step: 3 Unlock