

Question: help needed with part b a) What are the control limits for the mean chart? UCLx=20.18 ounces (round your response to two decimat places). LCLx=
help needed with part b 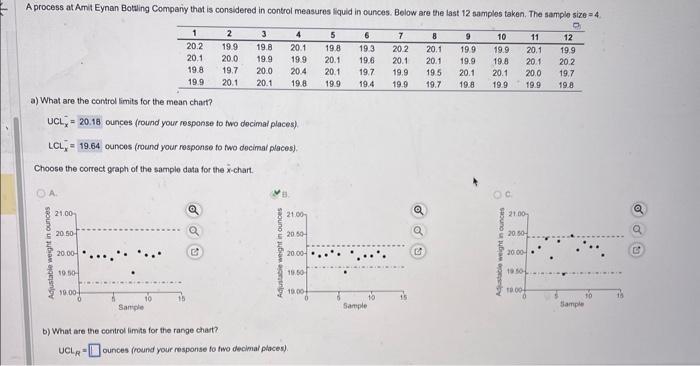
a) What are the control limits for the mean chart? UCLx=20.18 ounces (round your response to two decimat places). LCLx= ounces (round your rosponse fo two decimal places). Choose the correct graph of the sample data for the x-chart. b) What are the control limits for the range chart? UCLR= ounces (round your response to two decimal places)
Step by Step Solution
There are 3 Steps involved in it
1 Expert Approved Answer
Step: 1 Unlock

Question Has Been Solved by an Expert!
Get step-by-step solutions from verified subject matter experts
Step: 2 Unlock
Step: 3 Unlock