

Question: Help please 1l. Standard Charging Circuit The circuit shown (fig 6) is the lab-implemented version g of figure 2. Note that two voltage sensors are
Help please
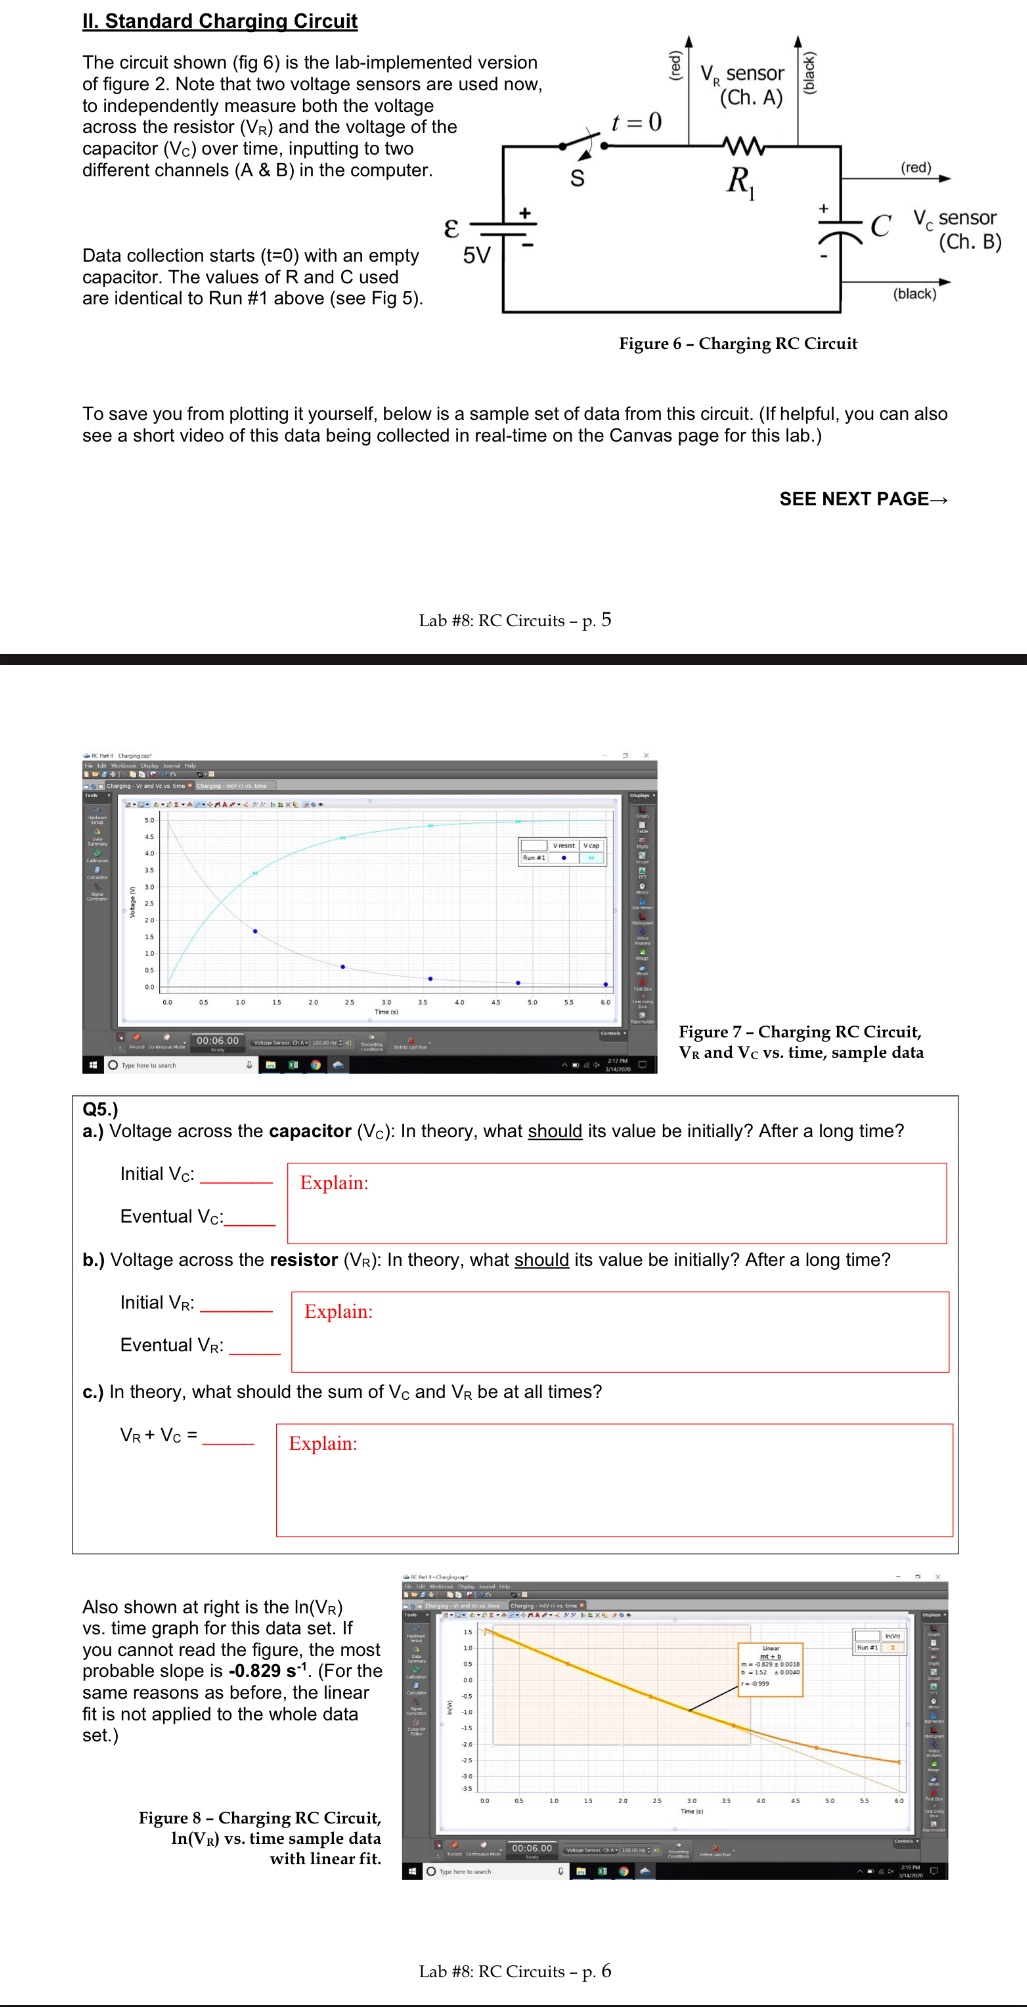
1l. Standard Charging Circuit The circuit shown (fig 6) is the lab-implemented version g of figure 2. Note that two voltage sensors are used now, = to independently measure both the voltage across the resistor (Vr) and the voltage of the \\ capacitor (V) over time, inputting to two A different channels (A & B) in the computer. g V, sensor (Ch. A) (black) > C Vesensor Data collection starts (t=0) with an empty 5v |~ - R capacitor. The values of R and C used are identical to Run #1 above (see Fig 5). (black) Figure 6 - Charging RC Circuit To save you from plotting it yourself, below is a sample set of data from this circuit. (If helpful, you can also see a short video of this data being collected in real-time on the Canvas page for this lab.) SEE NEXT PAGE Lab #8: RC Circuits - p. 5 Figure 7 - Charging RC Circuit, Vg and Vc vs. time, sample data Q5.) a.) Voltage across the capacitor (Vc): In theory, what should its value be initially? After a long time? Initial Ve: Explain: Eventual Vc: b.) Voltage across the resistor (Vr): In theory, what should its value be initially? After a long time? Initial V: Explain: Eventual Vg: c.) In theory, what should the sum of V and Vg be at all times? YrtVer=. Explain: Also shown at right is the In(Vg) vs. time graph for this data set. If you cannot read the figure, the most probable slope is -0.829 s'. (For the same reasons as before, the linear fit is not applied to the whole data set.) Figure 8 - Charging RC Circuit, In(Vg) vs. time sample data with linear fit. Lab #8: RC Circuits - p. 6
Step by Step Solution
There are 3 Steps involved in it

Get step-by-step solutions from verified subject matter experts