

Question: Help please 5) Data analysis. (a) Descriptive statistics of your y variable and x variables (what is the mean, median, minimum, maximum, standard deviation, etc.
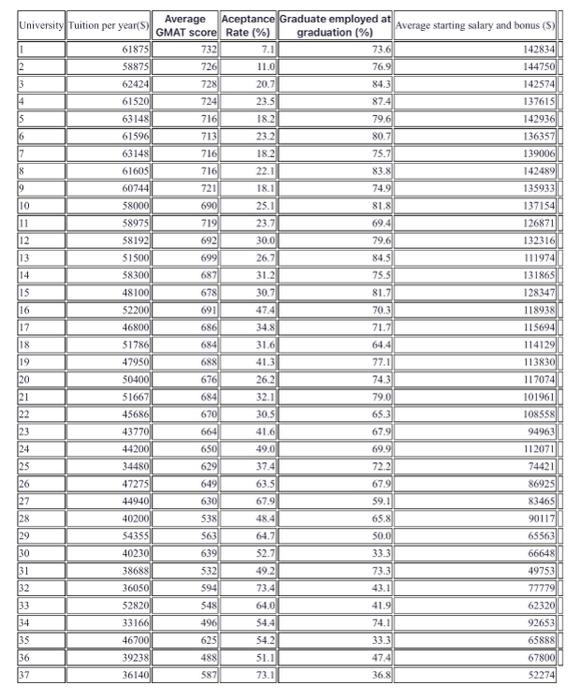
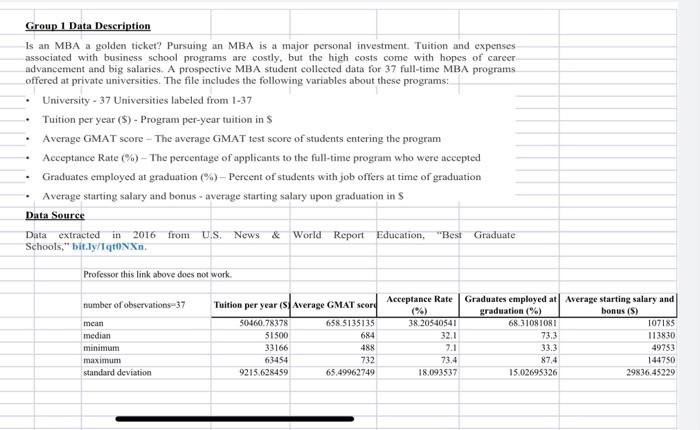
5) Data analysis. (a) Descriptive statistics of your y variable and x variables (what is the mean, median, minimum, maximum, standard deviation, etc. for each numerical variable? What is the number of observations in each category for each categorical variable?). These should be summarized in a table with a full discussion. (b) At least two hypothesis tests. For each test, formulate your null and alternative hypotheses, specify the testing method you used (one sample test, two sample test, or analysis of variance, etc.), and explain the results and inferences that you obtained. (c) Describe your regression model (the y=f(x) relationship that you set out to explain and state the formal model), and show and explain your regression results from Excel. This should include the partial regression coefficients, assumption tests, and other relevant statistics (coefficient of determination, F test, t test). Please note that simply attaching a ream of computer printout is not what is meant by including an appropriate statistical analysis. You should clearly explain how you reach the conclusions and the objectives of your project. Group 1 Data Description Is an MBA a golden ticket? Pursuing an MBA is a major personal investment. Tuition and expenses associated with business school programs are costly, but the high costs come with hopes of career advancement and big salaries. A prospective MBA student collected data for 37 full-time MBA programs offered at private universities. The file includes the following variables about these programs: - University - 37 Universities labeled from 1-37 - Tuition per year (\$) - Program per-year tuition in $ - Average GMAT score - The average GMAT test score of students entering the program - Acceptance Rate (%) - The percentage of applicants to the full-time program who were aceepted - Graduates cmployed at graduation (%)-Percent of students with job offers at time of graduation - Average starting salary and bonus - average starting salary upon graduation in $ Data Source Data extracted in 2016 from U.S. News \& World Report Education, "Best Giraduate Schools, bit.ly/tqtoNXn. Professor this link above docs not work
Step by Step Solution
There are 3 Steps involved in it

Get step-by-step solutions from verified subject matter experts