

Question: Help please! 5. The chart below shows the Supply/Demand for bonds. The vertical axis shows the bond Prices and the horizontal axis shows the quantity
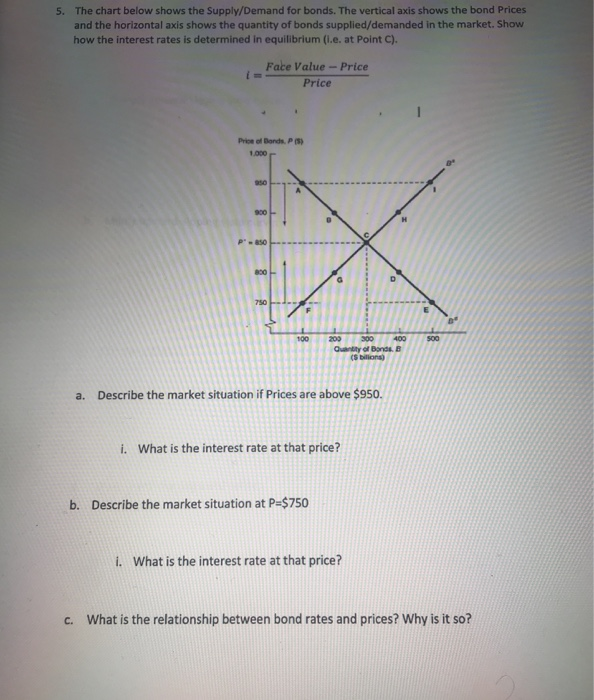
5. The chart below shows the Supply/Demand for bonds. The vertical axis shows the bond Prices and the horizontal axis shows the quantity of bonds supplied/demanded in the market. Show how the interest rates is determined in equilibrium (l.e. at Point C). Face Value - Price Price of Bands P5 o - - - 209 300 400 Quantity of Bande (5 bilions) a. Describe the market situation if Prices are above $950. i. What is the interest rate at that price? b. Describe the market situation at P=$750 i. What is the interest rate at that price? C. What is the relationship between bond rates and prices? Why is it so? 5. The chart below shows the Supply/Demand for bonds. The vertical axis shows the bond Prices and the horizontal axis shows the quantity of bonds supplied/demanded in the market. Show how the interest rates is determined in equilibrium (l.e. at Point C). Face Value - Price Price of Bands P5 o - - - 209 300 400 Quantity of Bande (5 bilions) a. Describe the market situation if Prices are above $950. i. What is the interest rate at that price? b. Describe the market situation at P=$750 i. What is the interest rate at that price? C. What is the relationship between bond rates and prices? Why is it so
Step by Step Solution
There are 3 Steps involved in it

Get step-by-step solutions from verified subject matter experts