

Question: 4. The chart below shows the Supply/Demand for bonds. The vertical axis shows the bond Prices and the horizontal axis shows the quantity of
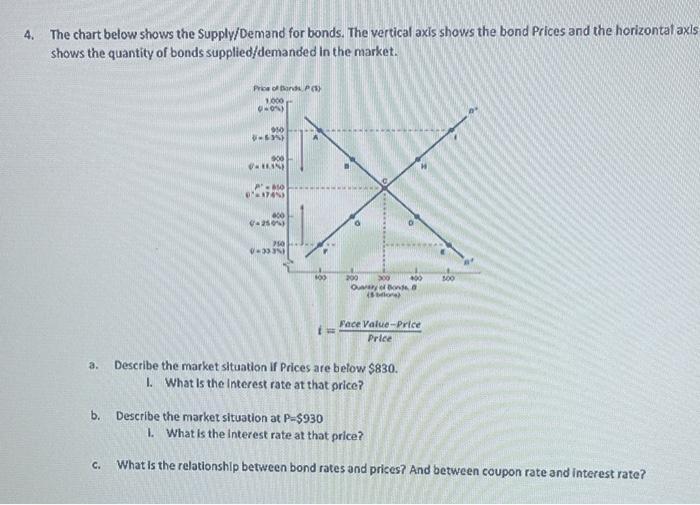
4. The chart below shows the Supply/Demand for bonds. The vertical axis shows the bond Prices and the horizontal axis shows the quantity of bonds supplied/demanded in the market. Price of Bonds P (5) 1,000 7013) 950 77632) 900 0-174%) 400 +250) 750 -3535) 100 200 300 Quarry of Bonds, (b) 400 500 a. Face Value-Price Price Describe the market situation if Prices are below $830. 1. What Is the Interest rate at that price? b. Describe the market situation at P-$930 C. 1. What is the interest rate at that price? What is the relationship between bond rates and prices? And between coupon rate and interest rate?
Step by Step Solution
There are 3 Steps involved in it

Get step-by-step solutions from verified subject matter experts