

Question: Help Please! Answer the questions based on the table given for each stage. Stage 1: Starting question: 1. What is the earliest year for a
 Help
Help 
Please!
Answer the questions based on the table given for each stage.
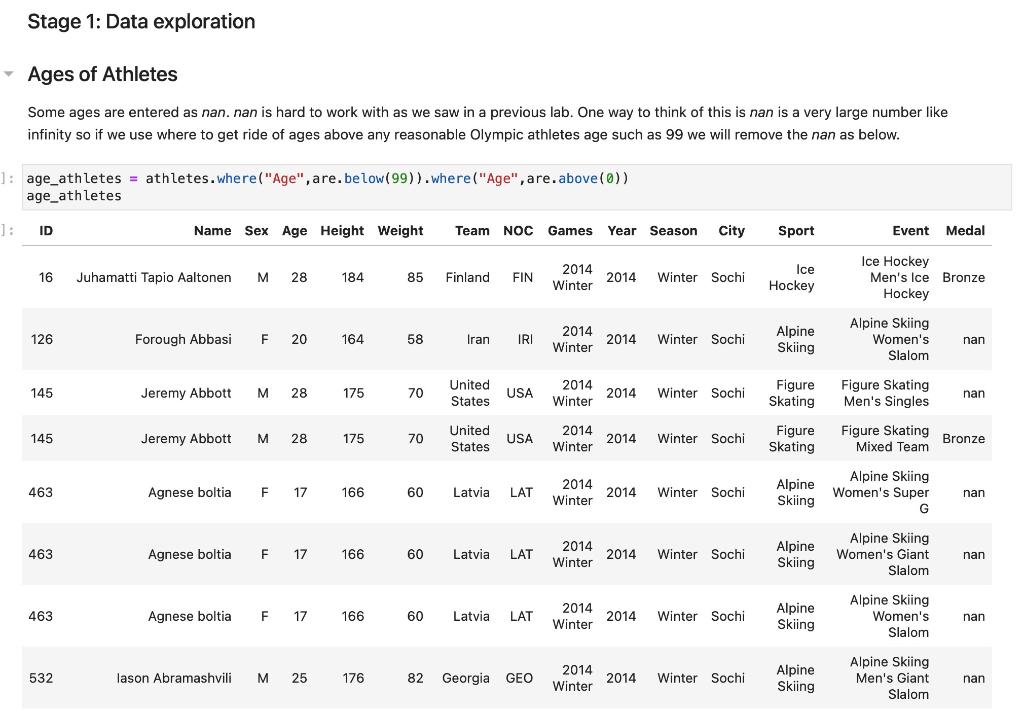
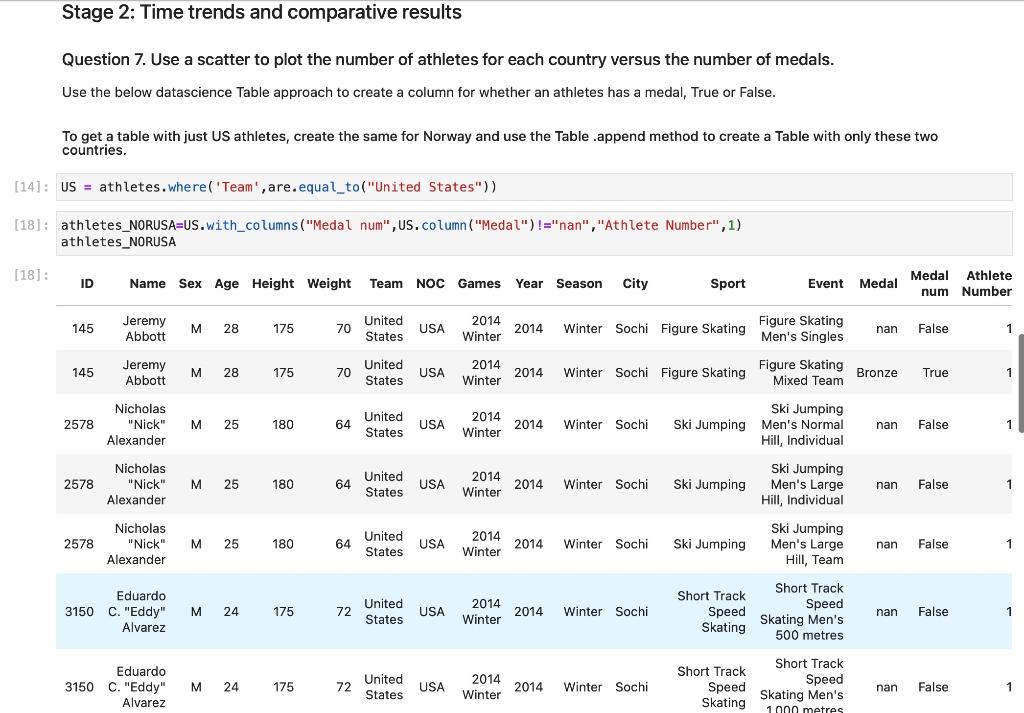
Stage 1: Starting question: 1. What is the earliest year for a Winter Olympics in this dataset? 2. Examine the distribution of the age of all Olympians with both a five number summary, and with a histogram. To get the five number summary (min, max, median, mean, and standard deviation) using np.min, np.max, np.median, np.mean, and np.std respectively on the corresponding column array. 3. Now examine the age distribution of only gold medal winners with both a five number summary, and with a histogram. Compare the distributions from question 2 and 3 . 4. Now look at number of athletes and medals for top 10 countries. Use the .group method. What are the top ten countries in number of athletes? The "nan" in the "Medal" column simply means an athletes did not win a medal but still participated. Get the five number summary (min, max, median, mean, and standard deviation) again. 5. What are the top ten countries in number of Gold, silver, bronze medals, and total medals? You should have four sets of top ten countries for each of the scenarios. Again, get the five number summary (min, max, median, mean, and standard deviation). Hint: . where("Medal", are. not_equal_to("nan")) to get only medal winners. Consider how to create a column for the sum of the three medal categories. 6. What are the top 5 sports in terms of number of athletes? 7. Which sports (top 5) have awarded the most medals? 8. Which sports (top 5) awarded the most medals in Lake Placid, New York (1980, https://www.lakeplacid.com/do/activities/olympic-sites ). 9. Remember medals are awarded to each participant on a team, how does this effect the results you found above? Ages of Athletes Some ages are entered as nan. nan is hard to work with as we saw in a previous lab. One way to think of this is nan is a very large number like infinity so if we use where to get ride of ages above any reasonable Olympic athletes age such as 99 we will remove the nan as below. age_athletes = athletes.where("Age", are.below (99) ). where("Age", are.above(0)) ano athlatoc Stage 2 : Time trends and comparative results 1. Plot the trend in number of athletes per year. Hint: athletes.group ("Year") .plot ("Year", "count") 2. Plot the number of medals per year. 3. Plot the number of gold medals per year excluding "Ice Hockey", why hockey? 4. Plot an overlay of gold, silver, and bronze medals as a function of year on the same plot excluding hockey. 5. Compare the US and Norway medal counts as a function of year by overlaying their counts. Hint: You could create separate tables for the US and Norway using an appropriate .where method. Now these tables can be combined using the Table .append method which merges two tables for instance, NORUSA = US.append(Norway). You may also find .pivot useful. 6. Now use a scatter plot (.scatter() ) to look at the number of athletes per year for the US versus that for Norway. What trends do you see? 7. Use a scatter to plot the number of athletes for each country versus the number of medals. Stage 2: Time trends and comparative results Question 7. Use a scatter to plot the number of athletes for each country versus the number of medals. Use the below datascience Table approach to create a column for whether an athletes has a medal, True or False. To get a table with just US athletes, create the same for Norway and use the Table .append method to create a Table with only these two countries. \# Extra Python functionality to import from datascience import \# datascience Table import numpy as np import pandas as pd omatplotlib inline import matplotlib.pyplot as plt plt.style.use('fivethirtyeight') \# Fix for datascience plots import collections as collections import collections.abc as abc collections. Iterable = abc. Iterable
Step by Step Solution
There are 3 Steps involved in it

Get step-by-step solutions from verified subject matter experts