

Question: help please !! Based on the sampling done, the control limits for 3-sigma x chart are (round all intermediate calculations to three decimal places beforo
help please !! 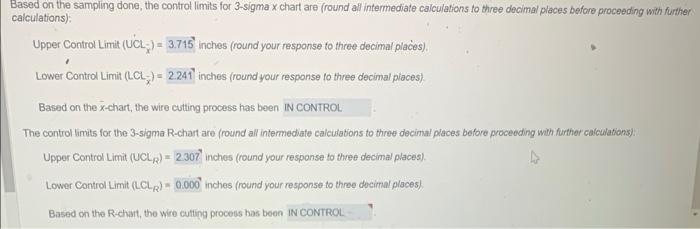
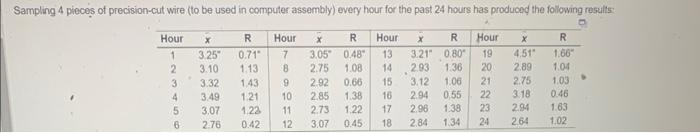
Based on the sampling done, the control limits for 3-sigma x chart are (round all intermediate calculations to three decimal places beforo proceeding with furthe calculations): Upper Control Limit (UCLx)=3.715 inches (round your response to three decimal placies). Lower Control Limitm(LCLx)= inches (round your response to three decimal places). Based on the x-chart, the wire cutting process has been The control limits for the 3-sigma R-chart are (round all intermediate calculations to three decimal places before proceeding with further calculations): Upper Control Limit (UCLR)=2.307 inches (round your response to three decimal places). Lower Control Limit (LCLR)=0.0002 inches (round your respanse to three docimal places). Based on the R-chart, the wire cutling process has been Sampling 4 piecos of precision-cut wire (to be used in computer assembly) every hour for the past 24 hours has produced the following results: \begin{tabular}{ccc|ccc|ccc|ccc} \hline Hour & x & R & Hour & x & R & Hour & x & R & Hour & x & R \\ \hline 1 & 3.25 & 0.71 & 7 & 3.05 & 0.48 & 13 & 3.21 & 0.80 & 19 & 4.51 & 1.66 \\ 2 & 3.10 & 1.13 & 8 & 2.75 & 1.08 & 14 & 2.93 & 1.36 & 20 & 2.89 & 1.04 \\ 3 & 3.32 & 1.43 & 9 & 2.92 & 0.66 & 15 & 3.12 & 1.06 & 21 & 2.75 & 1.03 \\ 4 & 3.49 & 1.21 & 10 & 2.85 & 1.38 & 18 & 2.94 & 0.55 & 22 & 3.18 & 0.46 \\ 5 & 3.07 & 1.23 & 11 & 2.73 & 1.22 & 17 & 2.96 & 1.38 & 23 & 2.94 & 1.63 \\ 6 & 2.76 & 0.42 & 12 & 3.07 & 0.45 & 18 & 2.84 & 1.34 & 24 & 2.64 & 1.02 \\ \hline \end{tabular}
Step by Step Solution
There are 3 Steps involved in it
1 Expert Approved Answer
Step: 1 Unlock

Question Has Been Solved by an Expert!
Get step-by-step solutions from verified subject matter experts
Step: 2 Unlock
Step: 3 Unlock