

Question: please solve it fast and correctly. I only have 15mins. pleasee Develop appropriate control charts and determine whether there is any cause for concern in
please solve it fast and correctly. I only have 15mins. pleasee
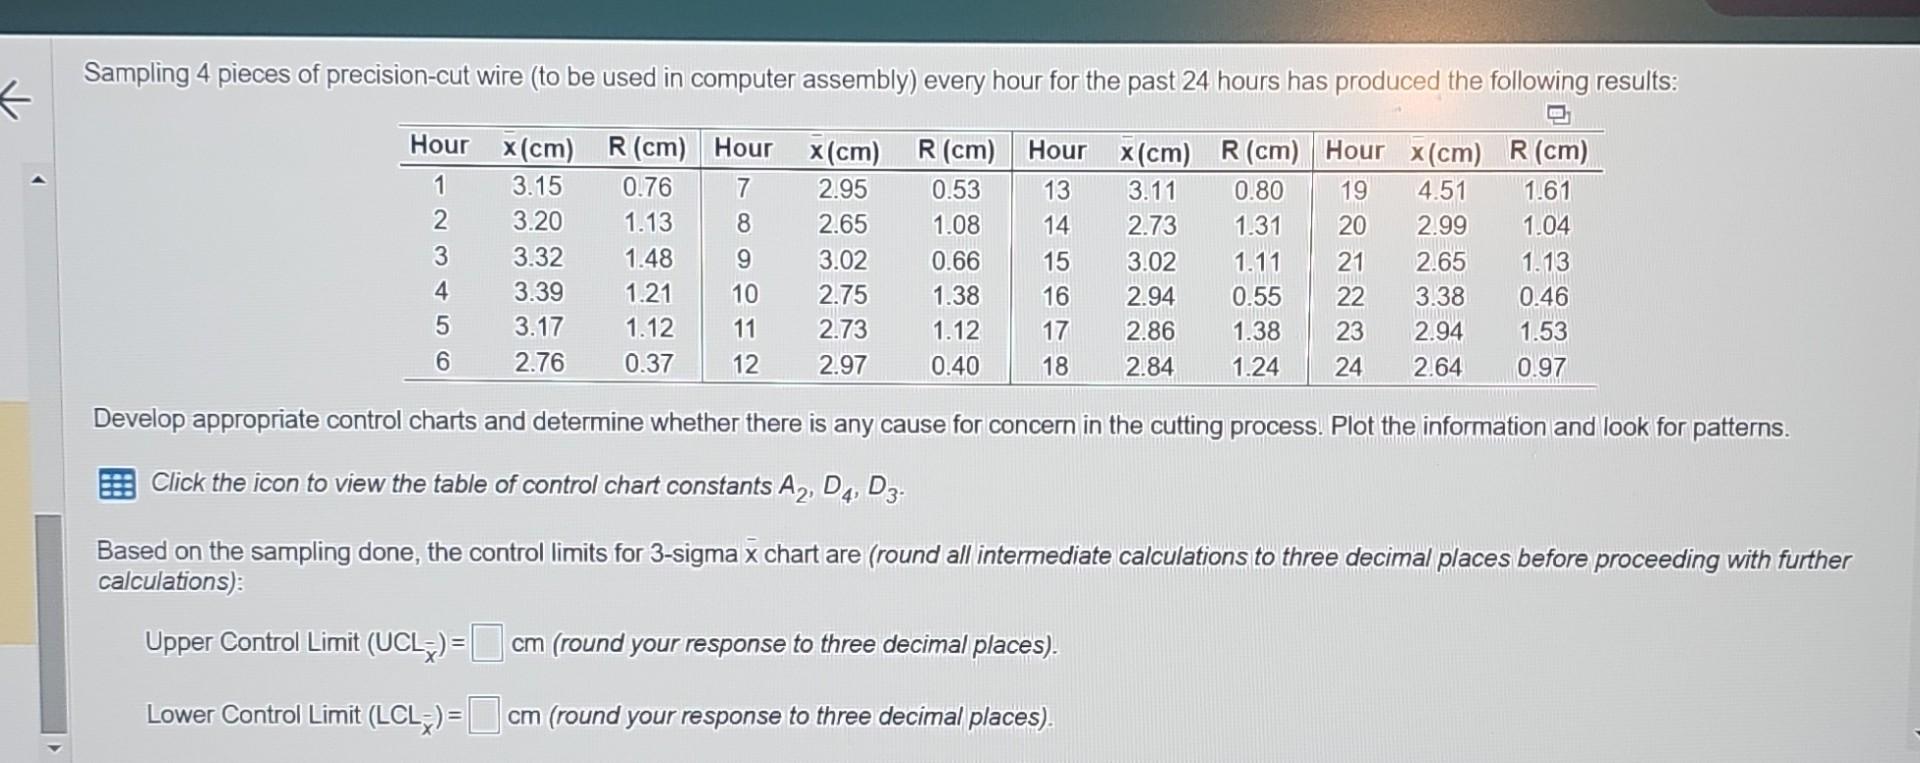
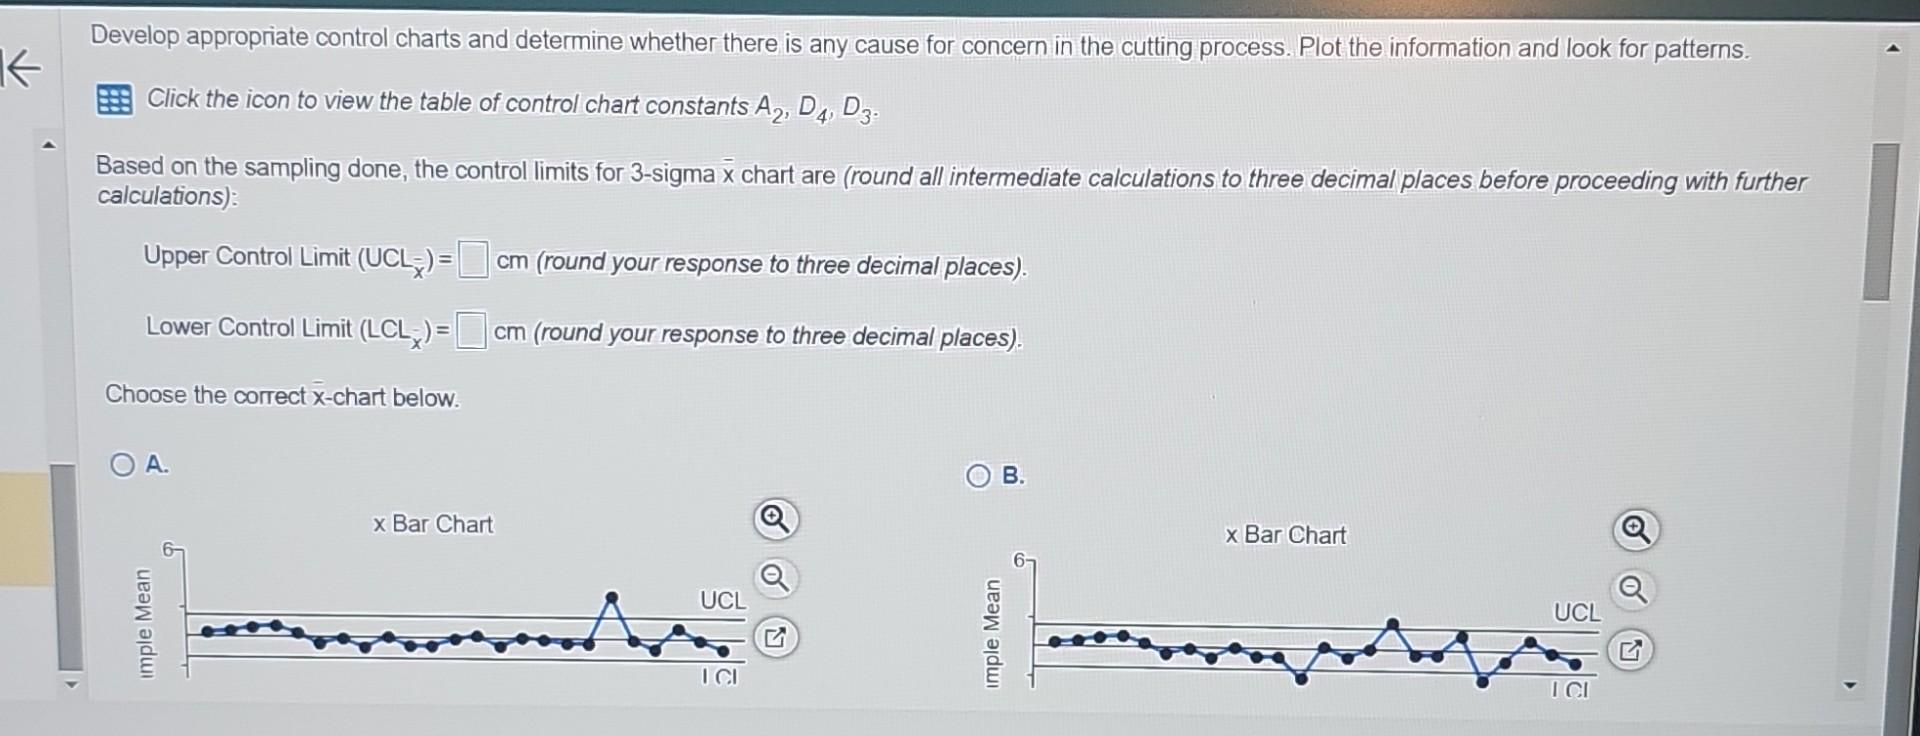
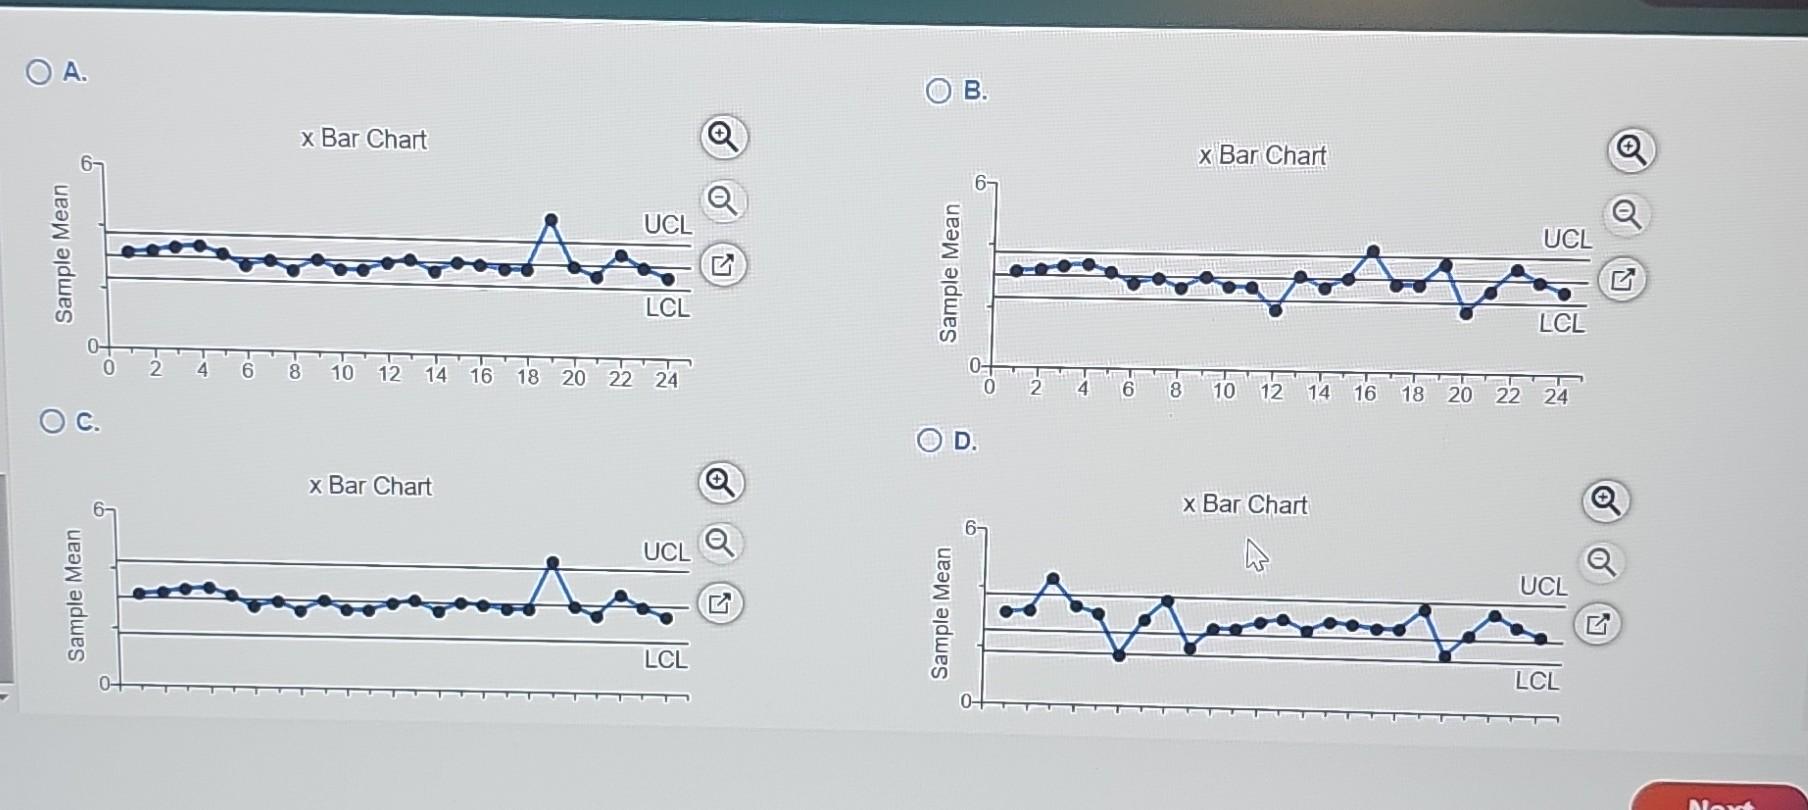
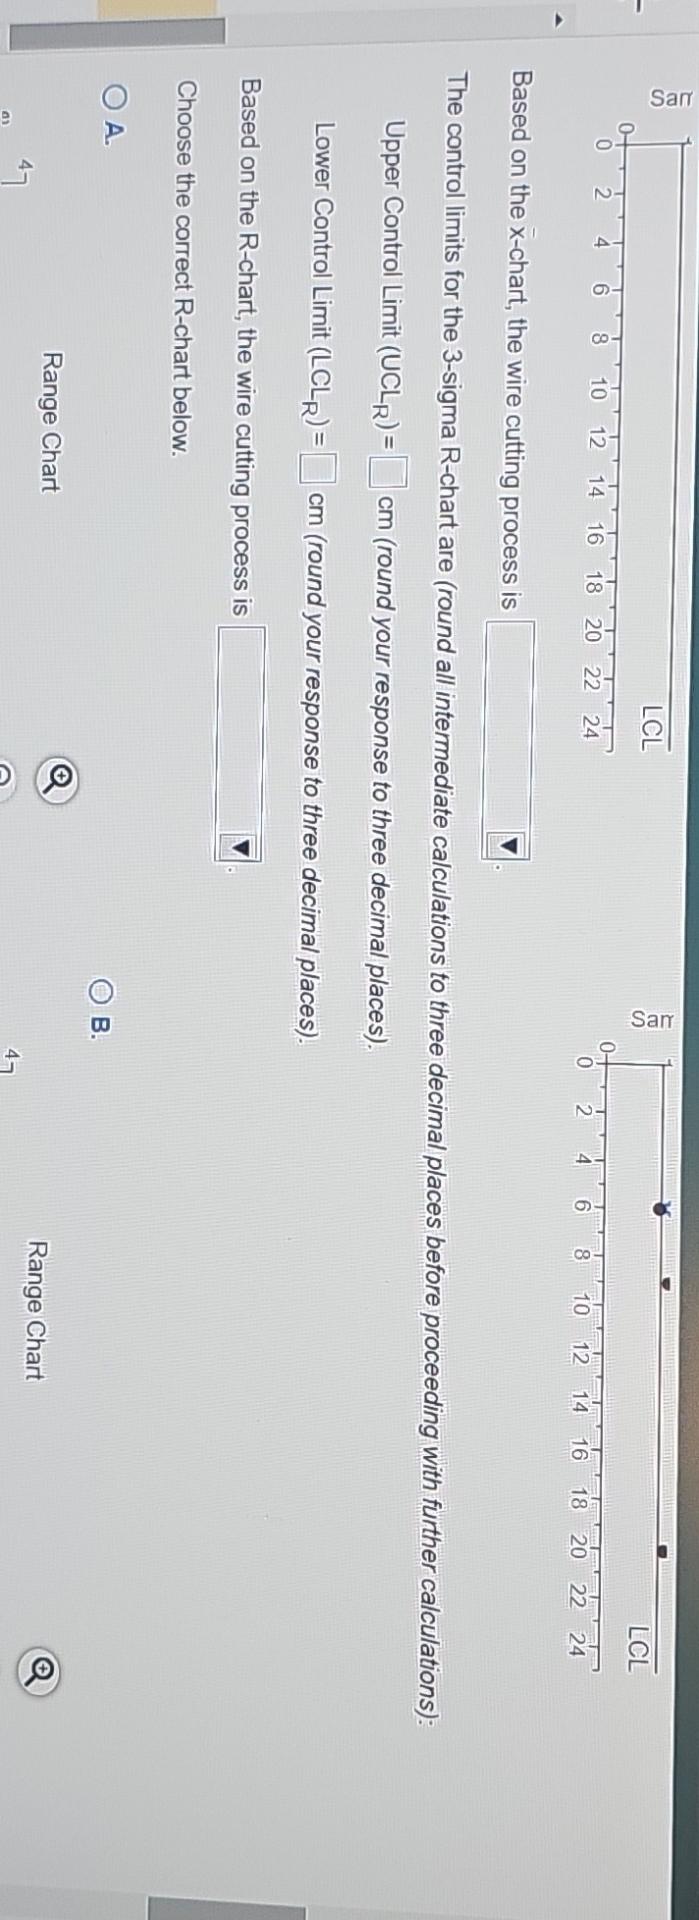
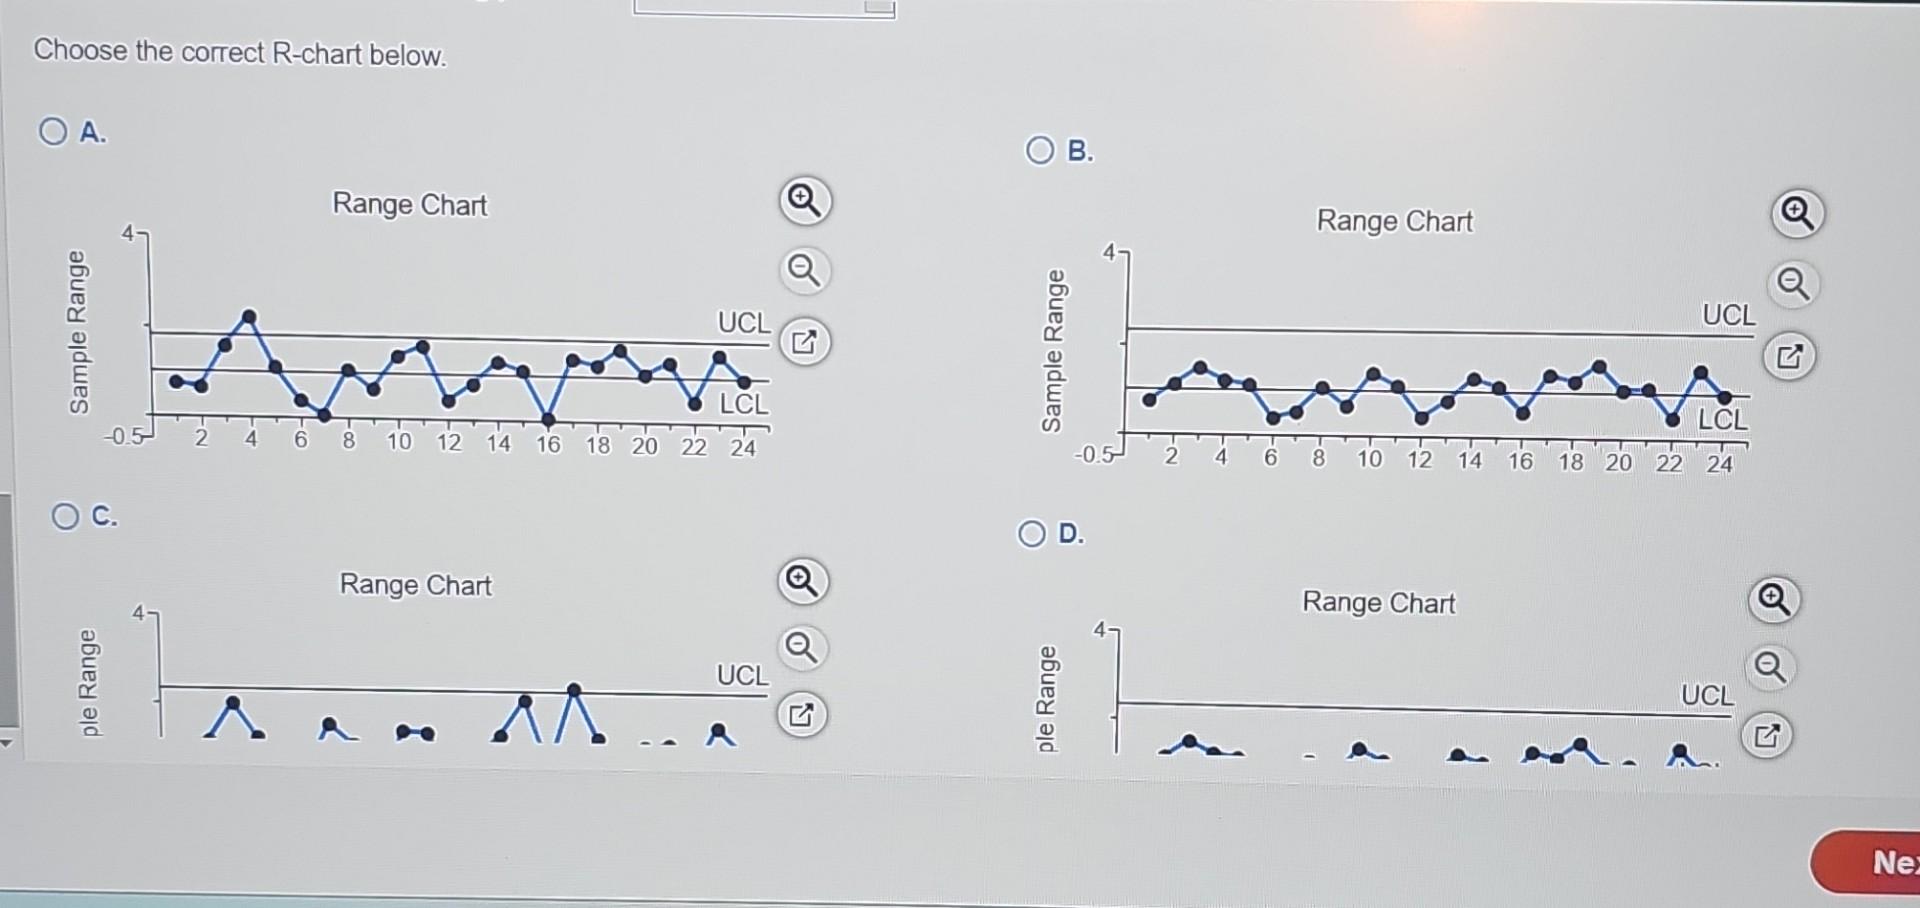
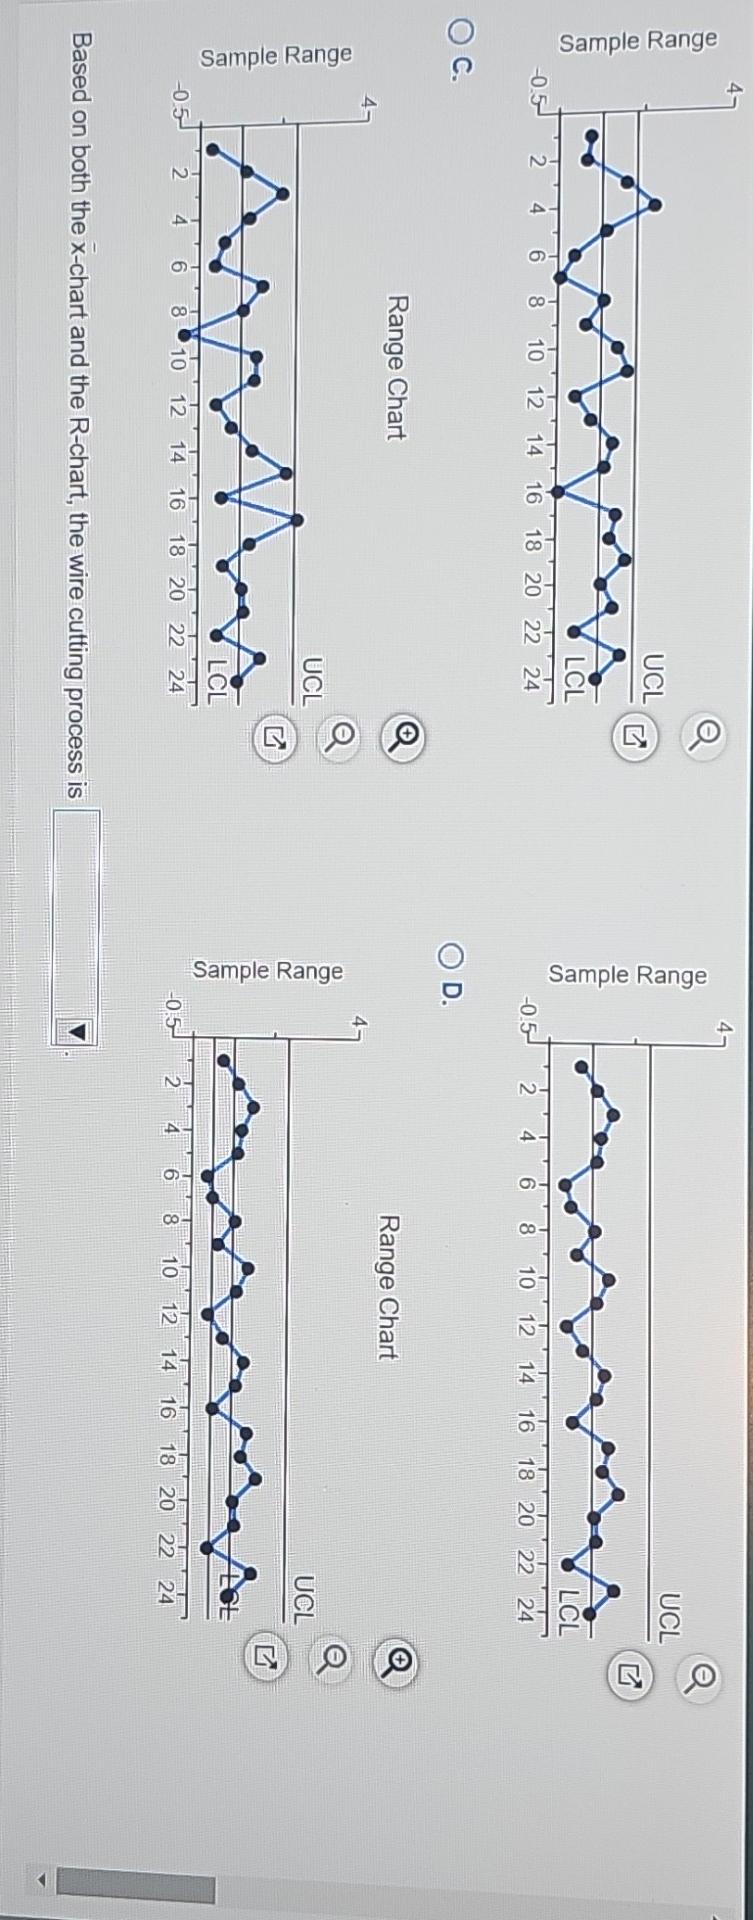
Develop appropriate control charts and determine whether there is any cause for concern in the cutting process. Plot the information and look for patterns. Click the icon to view the table of control chart constants A2,D4,D3. Based on the sampling done, the control limits for 3-sigma x chart are (round all intermediate calculations to three decimal places before proceeding with further calculations): Upper Control Limit (UCL)=cm (round your response to three decimal places). Lower Control Limit (LCLx)=cm (round your response to three decimal places). Develop appropriate control charts and determine whether there is any cause for concern in the cutting process. Plot the information and look for patterns. Click the icon to view the table of control chart constants A2,D4,D3. Based on the sampling done, the control limits for 3 -sigma x chart are (round all intermediate calculations to three decimal places before proceeding with further calculations): Upper Control Limit (UCL)=cm (round your response to three decimal places). Lower Control Limit (LCL)=cm (round your response to three decimal places). A. x Bar Chart c. x Bar Chart B. x Bar Chart D. Based on the x-chart, the wire cutting process is The control limits for the 3-sigma R-chart are (round all intermediate calculations to three decimal places before proceeding with further calculations): Upper Control Limit (UCLR)=cm (round your response to three decimal places). Lower Control Limit (LCLR)=cm (round your response to three decimal places). Based on the R-chart, the wire cutting process is Choose the correct R-chart below. A. B. Range Chart Choose the correct R-chart below. A. Based on both the x-chart and the R-chart, the wire cutting process is Develop appropriate control charts and determine whether there is any cause for concern in the cutting process. Plot the information and look for patterns. Click the icon to view the table of control chart constants A2,D4,D3. Based on the sampling done, the control limits for 3-sigma x chart are (round all intermediate calculations to three decimal places before proceeding with further calculations): Upper Control Limit (UCL)=cm (round your response to three decimal places). Lower Control Limit (LCLx)=cm (round your response to three decimal places). Develop appropriate control charts and determine whether there is any cause for concern in the cutting process. Plot the information and look for patterns. Click the icon to view the table of control chart constants A2,D4,D3. Based on the sampling done, the control limits for 3 -sigma x chart are (round all intermediate calculations to three decimal places before proceeding with further calculations): Upper Control Limit (UCL)=cm (round your response to three decimal places). Lower Control Limit (LCL)=cm (round your response to three decimal places). A. x Bar Chart c. x Bar Chart B. x Bar Chart D. Based on the x-chart, the wire cutting process is The control limits for the 3-sigma R-chart are (round all intermediate calculations to three decimal places before proceeding with further calculations): Upper Control Limit (UCLR)=cm (round your response to three decimal places). Lower Control Limit (LCLR)=cm (round your response to three decimal places). Based on the R-chart, the wire cutting process is Choose the correct R-chart below. A. B. Range Chart Choose the correct R-chart below. A. Based on both the x-chart and the R-chart, the wire cutting process is
Step by Step Solution
There are 3 Steps involved in it

Get step-by-step solutions from verified subject matter experts