

Question: Help Please Create equation that approximates your data set Graph the equation with a labeled x and y axis In a paragraph explain how you
Help Please
- Create equation that approximates your data set
- Graph the equation with a labeled x and y axis
- In aparagraphexplain how you determined your equationthenstate the max, min, and etc.
- In a fewsentencesaddress how well your model(graph) fits the data.Give specific values
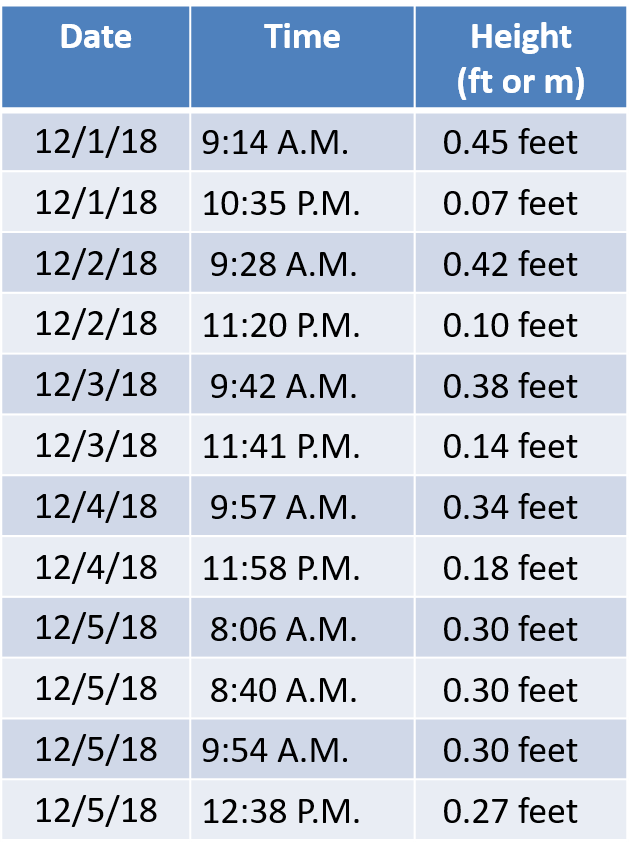
Time Height (ft or m) 12/1/18 9:14 A.M. 0.45 feet 12/1/18 10:35 RM. 0.07 feet 12/2/18 9:28 A.M. 0.42 feet 12/2/18 11:20 RM. 0.10 feet 12/3/18 9:42 A.M. 0.38 feet 12/3/18 11:41 RM. 0.14 feet 12/4/18 9:57 A.M. 0.34 feet 12/4/18 11:58 RM. 0.18 feet 12/5/18 8:06 A.M. 0.30 feet 12/5/18 8:40 A.M. 0.30 feet 12/5/18 9:54 A.M. 0.30 feet 12/5/18 12:38 RM. 0.27 feet
Step by Step Solution
There are 3 Steps involved in it
1 Expert Approved Answer
Step: 1 Unlock

Question Has Been Solved by an Expert!
Get step-by-step solutions from verified subject matter experts
Step: 2 Unlock
Step: 3 Unlock