

Question: help please Difference Quantiles Summary Statistics 100 06 maximum Mean 15.909097 99.5% 60 Sid Dev 15.863847 97.5%% 60 5td Er Mean 2.7615085 90.0% 39.6 Upper
help please
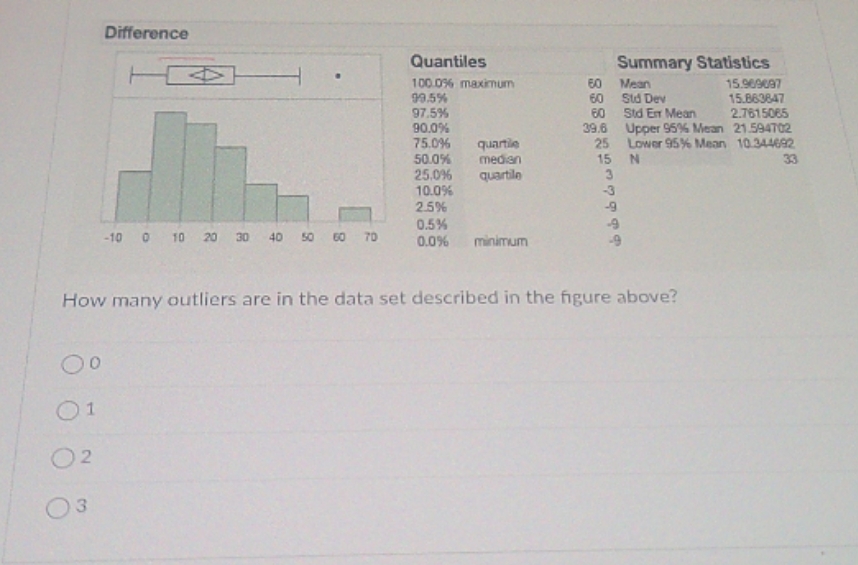
Difference Quantiles Summary Statistics 100 06 maximum Mean 15.909097 99.5% 60 Sid Dev 15.863847 97.5%% 60 5td Er Mean 2.7615085 90.0% 39.6 Upper 95%% Mean 21.594702 75.046 quartile 25 Lower 95% Mean 10.344682 50.0% median 15 N 33 25,06 quartile 3 10.09% -3 2.5% -9 0.5% -10 0 10 20 30 40 50 50 70 0.0% minimum How many outliers are in the data set described in the figure above? Oo O1 O2 0 3
Step by Step Solution
There are 3 Steps involved in it
1 Expert Approved Answer
Step: 1 Unlock

Question Has Been Solved by an Expert!
Get step-by-step solutions from verified subject matter experts
Step: 2 Unlock
Step: 3 Unlock