

Question: help please, explanation on how you got the numbers too. will upvote on the all the answers. Footwear Operations in North America Historical Operating Performance
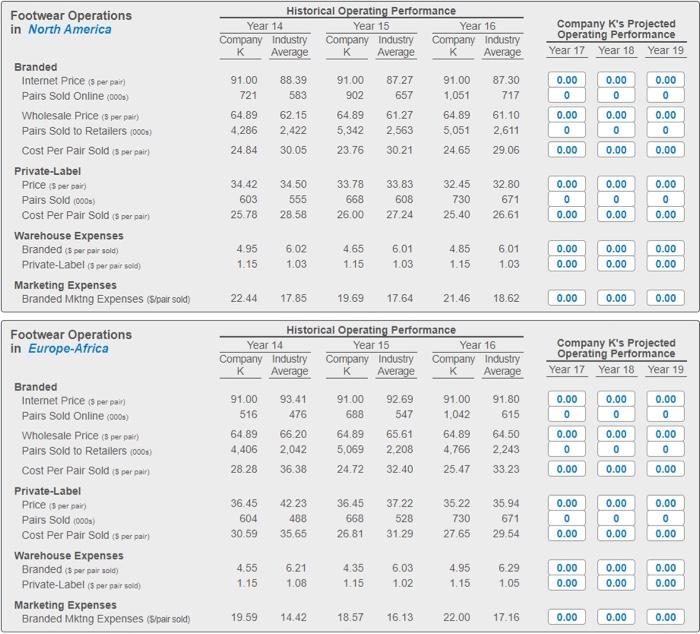
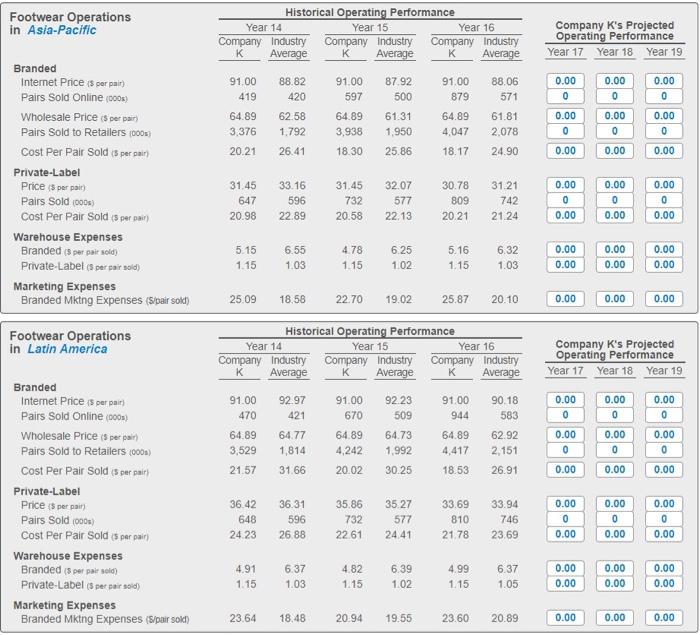
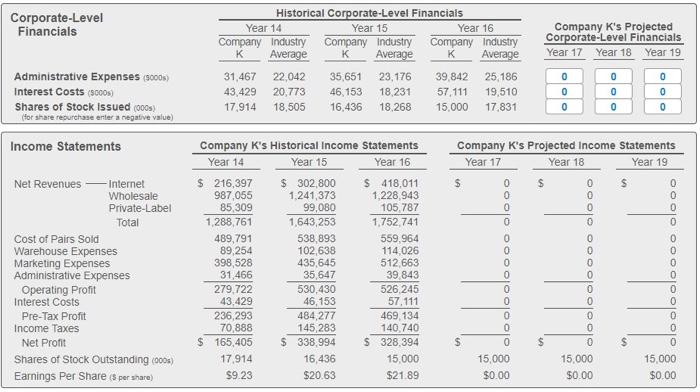
Footwear Operations in North America Historical Operating Performance Year 14 Year 15 Year 16 Company Industry Company Industry Company Industry K Average K Average K Average Company K's Projected Operating Performance Year 17 Year 18 Year 19 0.00 91.00 721 88.39 583 91.00 902 8727 657 91.00 1.051 0.00 0 0.00 0 0 64.89 4,286 24.84 62.15 2.422 30.05 64.89 5,342 23.76 61.27 2,563 64.89 5.051 87.30 717 61.10 2.611 29.06 0.00 0 0.00 0.00 0 0.00 0 30.21 24.65 0.00 0.00 Branded Internet Price $ per pair Pairs Sold Online (000) Wholesale Price (s per pair) Pairs Sold to Retailers (000 Cost Per Pair Sold (5 per pair Private Label Price (5 per sain Pairs Sold 000) Cost Per Pair Sold (s per pair Warehouse Expenses Branded (5 per pair sold) Private-Label (per pair sold) Marketing Expenses Branded Mking Expenses (S/pair sold) 34.42 603 25.78 34.50 555 28.58 33.78 668 26.00 33.83 608 27 24 32.45 730 25.40 32.80 671 26.61 0.00 0 0.00 0.00 0 0.00 0.00 0 0.00 4.95 1.15 6.02 1.03 4.65 1.15 6.01 1.03 4.85 1.15 6.01 1.03 0.00 0.00 0.00 0.00 0.00 0.00 22.44 17.85 19.69 17 64 21.46 18.62 0.00 0.00 0.00 Footwear Operations in Europe Africa Historical Operating Performance Year 14 Year 15 Year 16 Company Industry Company Industry Company Industry K Average K Average K Average Company K's Projected Operating Performance Year 17 Year 18 Year 19 91.00 516 93.41 476 91.00 688 92.69 547 0.00 0 0.00 0 0.00 0 91.00 1,042 64.89 4,766 64.89 4,406 66.20 2,042 36.38 64.89 5,069 65.61 2.208 32.40 91.80 615 64.50 2,243 33.23 0.00 0 0.00 0 0.00 0 28.28 24.72 25.47 0.00 0.00 0.00 Branded Internet Price per pair Pairs Sold Online (000) Wholesale Prices per pair Pairs sold to Retailers (0001) Cost Per Pair Sold is per pair) Private Label Price per pair Pairs Sold 1000) Cost Per Pair Sold (5 per pair Warehouse Expenses Branded (5 per pair sold) Private-Label (s per pair Fold Marketing Expenses Branded Mking Expenses (Spair sold) 36.45 604 30.59 42.23 488 35,65 36.45 668 26.81 3722 528 31.29 35.22 730 27.65 35.94 671 29.54 0.00 0 0.00 0.00 0 0.00 0.00 0 0.00 0.00 4.55 1.15 6.21 1.08 4.35 1.15 6.03 1.02 4.95 1.15 6.29 1.05 0.00 0.00 0.00 0.00 0.00 19.59 14.42 18.57 16.13 22.00 17.16 0.00 0.00 0.00 Footwear Operations in Asia-Pacific Historical Operating Performance Year 14 Year 15 Year 16 Company Industry Company Industry Company Industry K Average K Average K Average Company K's Projected Operating Performance Year 17 Year 18 Year 19 0.00 0.00 0.00 0 0 0 91.00 419 88.82 420 91.00 597 87.92 500 91.00 879 88.06 571 61.81 2.078 64.89 3.376 62.58 1.792 26.41 64.89 3,938 18.30 61.31 1,950 64.89 4,047 0.00 0 0.00 0 0.00 0 20.21 25.86 18.17 24.90 0.00 0.00 0.00 Branded Internet Price (s per pair) Pairs Sold Online (000 Wholesale Price (s per pair Pairs Sold to Retailers 1000 Cost Per Pair Sold 6 per gair) Private Label Price 3 per pair) Pairs Sold (2008) Cost Per Pair Sold (3 per pair) Warehouse Expenses Branded (5 per pair sold) Private-Label (s per pair old) Marketing Expenses Branded Mktng Expenses (S/pair solt) 0.00 31.45 647 20.98 33.16 596 22.89 31.45 732 20.58 32.07 577 22.13 30.78 809 2021 31.21 742 21.24 0.00 0 0.00 0 0.00 0 0.00 0.00 5.15 1.15 6.55 1.03 4.78 1.15 6.25 1.02 5.16 1.15 6.32 1.03 1 0.00 0.00 0.00 0.00 0.00 0.00 25.09 18.58 22.70 19.02 25.87 20.10 0.00 0.00 0.00 Footwear Operations in Latin America Historical Operating Performance Year 14 Year 15 Year 16 Company Industry Company Industry Company Industry K Average K Average K Average Company K's Projected Operating Performance Year 17 Year 18 Year 19 91.00 470 92.97 421 91.00 670 92.23 509 91.00 944 90.18 583 0.00 0 0.00 0 0.00 0 0.00 64.89 3,529 64.77 1,814 64.89 4.242 64.89 4,417 64.73 1.992 30.25 62.92 2.151 0.00 0 0.00 0 0 21.57 31.66 20.02 18.53 26.91 0.00 0.00 0.00 Branded Internet Price is per pair Pairs Sold Online (000) Wholesale Price (s per part Pairs Sold to Retailers (0001) Cost Per Pair Sold (s per sair) Private Label Price (5 per pair Pairs Sold 1000 Cost Per Pair Sold (5 per pair) Warehouse Expenses Branded (5 per pair solo Private Label ($ per pairs Marketing Expenses Branded Mktng Expenses (S/pair sold) 36.42 648 24 23 36.31 596 26.88 35.86 732 22.61 3527 577 24 41 33.69 810 21.78 33.94 746 23.69 0.00 0 0.00 0.00 0 0.00 0.00 0 0.00 4.91 1.15 6.37 1.03 4.82 1.15 6.39 1.02 4.99 1.15 6.37 1.05 0.00 0.00 0.00 0.00 0.00 0.00 23.64 18.48 20.94 19.55 23.60 20.89 0.00 0.00 0.00 Corporate-Level Financials Company K's Projected Corporate-Level Financials Year 17 Year 18 Year 19 Historical Corporate-Level Financials Year 14 Year 15 Year 16 Company Industry Company Industry Company Industry K Average K Average K Average 31,467 22.042 35,651 23,176 39,842 25,186 43,429 20.773 46 153 18,231 57 111 19,510 17,914 18,505 16,436 18,268 15,000 17.831 Administrative Expenses (9000) Interest Costs (5000) Shares of Stock issued (000s) for share resurchase enter a negative value) 0 0 0 0 0 0 0 0 0 Income Statements Company K's Projected Income Statements Year 17 Year 18 Year 19 $ $ $ Net Revenues -Internet Wholesale Private Label Total Cost of Pairs Sold Warehouse Expenses Marketing Expenses Administrative Expenses Operating Profit Interest Costs Pre-Tax Profit Income Taxes Net Profit Shares of Stock Outstanding (900) Earnings Per Share ( per share) Company K's Historical Income Statements Year 14 Year 15 Year 16 $ 216,397 $ 302,800 $ 418,011 987.055 1,241,373 1.228,943 85,309 99,080 105,787 1.288,761 1,643,253 1,752,741 489,791 538,893 559,964 89,254 102,638 114,026 398,528 435,645 512 663 31,466 35 647 39.843 279,722 530,430 526,245 43.429 46,153 57.111 236,293 484,277 469 134 70,888 145,283 140,740 $ 165,405 $ 338,994 $ 328,394 17.914 16,436 15,000 $9.23 $20.63 $21.89 olo olo olo ooooooo OOOOOOOOOOOOO TIT Soloooooooooooo $ $ $ 15,000 $0.00 15,000 $0.00 15,000 $0.00 Footwear Operations in North America Historical Operating Performance Year 14 Year 15 Year 16 Company Industry Company Industry Company Industry K Average K Average K Average Company K's Projected Operating Performance Year 17 Year 18 Year 19 0.00 91.00 721 88.39 583 91.00 902 8727 657 91.00 1.051 0.00 0 0.00 0 0 64.89 4,286 24.84 62.15 2.422 30.05 64.89 5,342 23.76 61.27 2,563 64.89 5.051 87.30 717 61.10 2.611 29.06 0.00 0 0.00 0.00 0 0.00 0 30.21 24.65 0.00 0.00 Branded Internet Price $ per pair Pairs Sold Online (000) Wholesale Price (s per pair) Pairs Sold to Retailers (000 Cost Per Pair Sold (5 per pair Private Label Price (5 per sain Pairs Sold 000) Cost Per Pair Sold (s per pair Warehouse Expenses Branded (5 per pair sold) Private-Label (per pair sold) Marketing Expenses Branded Mking Expenses (S/pair sold) 34.42 603 25.78 34.50 555 28.58 33.78 668 26.00 33.83 608 27 24 32.45 730 25.40 32.80 671 26.61 0.00 0 0.00 0.00 0 0.00 0.00 0 0.00 4.95 1.15 6.02 1.03 4.65 1.15 6.01 1.03 4.85 1.15 6.01 1.03 0.00 0.00 0.00 0.00 0.00 0.00 22.44 17.85 19.69 17 64 21.46 18.62 0.00 0.00 0.00 Footwear Operations in Europe Africa Historical Operating Performance Year 14 Year 15 Year 16 Company Industry Company Industry Company Industry K Average K Average K Average Company K's Projected Operating Performance Year 17 Year 18 Year 19 91.00 516 93.41 476 91.00 688 92.69 547 0.00 0 0.00 0 0.00 0 91.00 1,042 64.89 4,766 64.89 4,406 66.20 2,042 36.38 64.89 5,069 65.61 2.208 32.40 91.80 615 64.50 2,243 33.23 0.00 0 0.00 0 0.00 0 28.28 24.72 25.47 0.00 0.00 0.00 Branded Internet Price per pair Pairs Sold Online (000) Wholesale Prices per pair Pairs sold to Retailers (0001) Cost Per Pair Sold is per pair) Private Label Price per pair Pairs Sold 1000) Cost Per Pair Sold (5 per pair Warehouse Expenses Branded (5 per pair sold) Private-Label (s per pair Fold Marketing Expenses Branded Mking Expenses (Spair sold) 36.45 604 30.59 42.23 488 35,65 36.45 668 26.81 3722 528 31.29 35.22 730 27.65 35.94 671 29.54 0.00 0 0.00 0.00 0 0.00 0.00 0 0.00 0.00 4.55 1.15 6.21 1.08 4.35 1.15 6.03 1.02 4.95 1.15 6.29 1.05 0.00 0.00 0.00 0.00 0.00 19.59 14.42 18.57 16.13 22.00 17.16 0.00 0.00 0.00 Footwear Operations in Asia-Pacific Historical Operating Performance Year 14 Year 15 Year 16 Company Industry Company Industry Company Industry K Average K Average K Average Company K's Projected Operating Performance Year 17 Year 18 Year 19 0.00 0.00 0.00 0 0 0 91.00 419 88.82 420 91.00 597 87.92 500 91.00 879 88.06 571 61.81 2.078 64.89 3.376 62.58 1.792 26.41 64.89 3,938 18.30 61.31 1,950 64.89 4,047 0.00 0 0.00 0 0.00 0 20.21 25.86 18.17 24.90 0.00 0.00 0.00 Branded Internet Price (s per pair) Pairs Sold Online (000 Wholesale Price (s per pair Pairs Sold to Retailers 1000 Cost Per Pair Sold 6 per gair) Private Label Price 3 per pair) Pairs Sold (2008) Cost Per Pair Sold (3 per pair) Warehouse Expenses Branded (5 per pair sold) Private-Label (s per pair old) Marketing Expenses Branded Mktng Expenses (S/pair solt) 0.00 31.45 647 20.98 33.16 596 22.89 31.45 732 20.58 32.07 577 22.13 30.78 809 2021 31.21 742 21.24 0.00 0 0.00 0 0.00 0 0.00 0.00 5.15 1.15 6.55 1.03 4.78 1.15 6.25 1.02 5.16 1.15 6.32 1.03 1 0.00 0.00 0.00 0.00 0.00 0.00 25.09 18.58 22.70 19.02 25.87 20.10 0.00 0.00 0.00 Footwear Operations in Latin America Historical Operating Performance Year 14 Year 15 Year 16 Company Industry Company Industry Company Industry K Average K Average K Average Company K's Projected Operating Performance Year 17 Year 18 Year 19 91.00 470 92.97 421 91.00 670 92.23 509 91.00 944 90.18 583 0.00 0 0.00 0 0.00 0 0.00 64.89 3,529 64.77 1,814 64.89 4.242 64.89 4,417 64.73 1.992 30.25 62.92 2.151 0.00 0 0.00 0 0 21.57 31.66 20.02 18.53 26.91 0.00 0.00 0.00 Branded Internet Price is per pair Pairs Sold Online (000) Wholesale Price (s per part Pairs Sold to Retailers (0001) Cost Per Pair Sold (s per sair) Private Label Price (5 per pair Pairs Sold 1000 Cost Per Pair Sold (5 per pair) Warehouse Expenses Branded (5 per pair solo Private Label ($ per pairs Marketing Expenses Branded Mktng Expenses (S/pair sold) 36.42 648 24 23 36.31 596 26.88 35.86 732 22.61 3527 577 24 41 33.69 810 21.78 33.94 746 23.69 0.00 0 0.00 0.00 0 0.00 0.00 0 0.00 4.91 1.15 6.37 1.03 4.82 1.15 6.39 1.02 4.99 1.15 6.37 1.05 0.00 0.00 0.00 0.00 0.00 0.00 23.64 18.48 20.94 19.55 23.60 20.89 0.00 0.00 0.00 Corporate-Level Financials Company K's Projected Corporate-Level Financials Year 17 Year 18 Year 19 Historical Corporate-Level Financials Year 14 Year 15 Year 16 Company Industry Company Industry Company Industry K Average K Average K Average 31,467 22.042 35,651 23,176 39,842 25,186 43,429 20.773 46 153 18,231 57 111 19,510 17,914 18,505 16,436 18,268 15,000 17.831 Administrative Expenses (9000) Interest Costs (5000) Shares of Stock issued (000s) for share resurchase enter a negative value) 0 0 0 0 0 0 0 0 0 Income Statements Company K's Projected Income Statements Year 17 Year 18 Year 19 $ $ $ Net Revenues -Internet Wholesale Private Label Total Cost of Pairs Sold Warehouse Expenses Marketing Expenses Administrative Expenses Operating Profit Interest Costs Pre-Tax Profit Income Taxes Net Profit Shares of Stock Outstanding (900) Earnings Per Share ( per share) Company K's Historical Income Statements Year 14 Year 15 Year 16 $ 216,397 $ 302,800 $ 418,011 987.055 1,241,373 1.228,943 85,309 99,080 105,787 1.288,761 1,643,253 1,752,741 489,791 538,893 559,964 89,254 102,638 114,026 398,528 435,645 512 663 31,466 35 647 39.843 279,722 530,430 526,245 43.429 46,153 57.111 236,293 484,277 469 134 70,888 145,283 140,740 $ 165,405 $ 338,994 $ 328,394 17.914 16,436 15,000 $9.23 $20.63 $21.89 olo olo olo ooooooo OOOOOOOOOOOOO TIT Soloooooooooooo $ $ $ 15,000 $0.00 15,000 $0.00 15,000 $0.00
Step by Step Solution
There are 3 Steps involved in it

Get step-by-step solutions from verified subject matter experts