

Question: HELP PLEASE. I NEED HELP EVALUATING THE COMPANY, APPLE, PERFORMANCE BASED ON THE NUMBER IN THE ATTACHED IMAGE. PROPER AND CLEAR ENGLISH PLEASE. THANKS IN
HELP PLEASE. I NEED HELP EVALUATING THE COMPANY, APPLE, PERFORMANCE BASED ON THE NUMBER IN THE ATTACHED IMAGE. PROPER AND CLEAR ENGLISH PLEASE. THANKS IN ADVANCE
Share what we learn from the data and information collected for this discussion. Interpret each of the ratios. Review the Financial Ratios Guidelines document for direction. Do you see any red flags? How profitable is the company in relation to sales? How profitable is it in relation to assets? How profitable is it in relation to equity? Sufficiently examining the data and information collected will likely require at least 250 words.
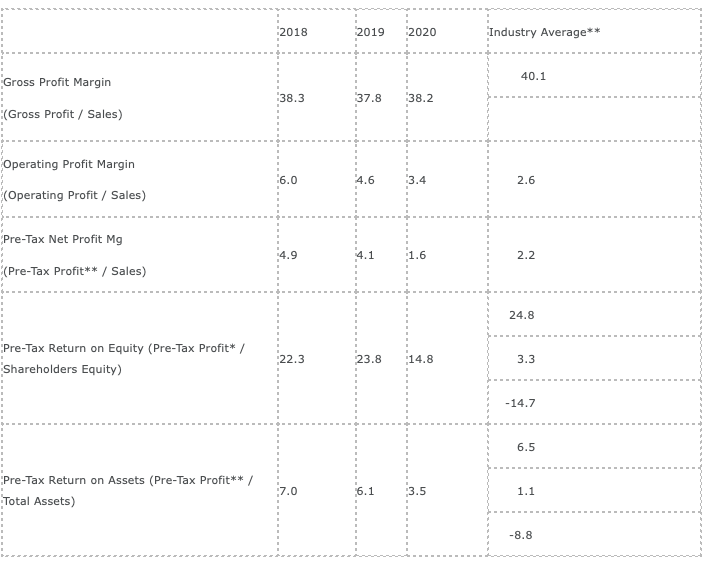
2018 2019 2020 Industry Average 40.1 Gross Profit Margin 38.3 37.8 38.2 (Gross Profit / Sales) Operating Profit Margin 16.0 4.6 3.4 2.6 (Operating Profit / Sales) Pre-Tax Net Profit Mg 4.9 1.6 2.2 (Pre-Tax Profit** / Sales) 24.8 Pre-Tax Return on Equity (Pre-Tax Profit* / Shareholders Equity) :22.3 23.8 14.8 3.3 -14.7 6.5 Pre-Tax Return on Assets (Pre-Tax Profit** / Total Assets) 7.0 6.1 3.5 1.1 -8.8 2018 2019 2020 Industry Average 40.1 Gross Profit Margin 38.3 37.8 38.2 (Gross Profit / Sales) Operating Profit Margin 16.0 4.6 3.4 2.6 (Operating Profit / Sales) Pre-Tax Net Profit Mg 4.9 1.6 2.2 (Pre-Tax Profit** / Sales) 24.8 Pre-Tax Return on Equity (Pre-Tax Profit* / Shareholders Equity) :22.3 23.8 14.8 3.3 -14.7 6.5 Pre-Tax Return on Assets (Pre-Tax Profit** / Total Assets) 7.0 6.1 3.5 1.1 -8.8
Step by Step Solution
There are 3 Steps involved in it

Get step-by-step solutions from verified subject matter experts