

Question: help please... Incorrect Question 5 0/1 pts The histogram below represents the weights (in pounds) of members of a certain high-school programming team. How many
help please...
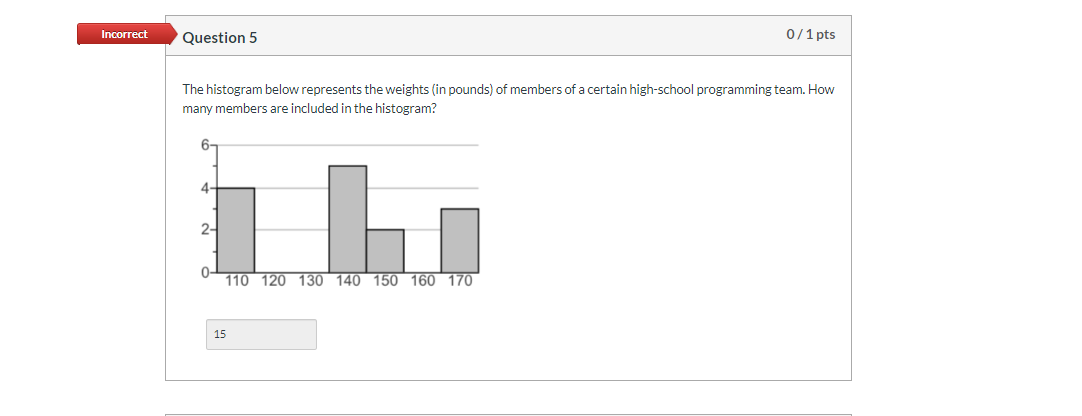
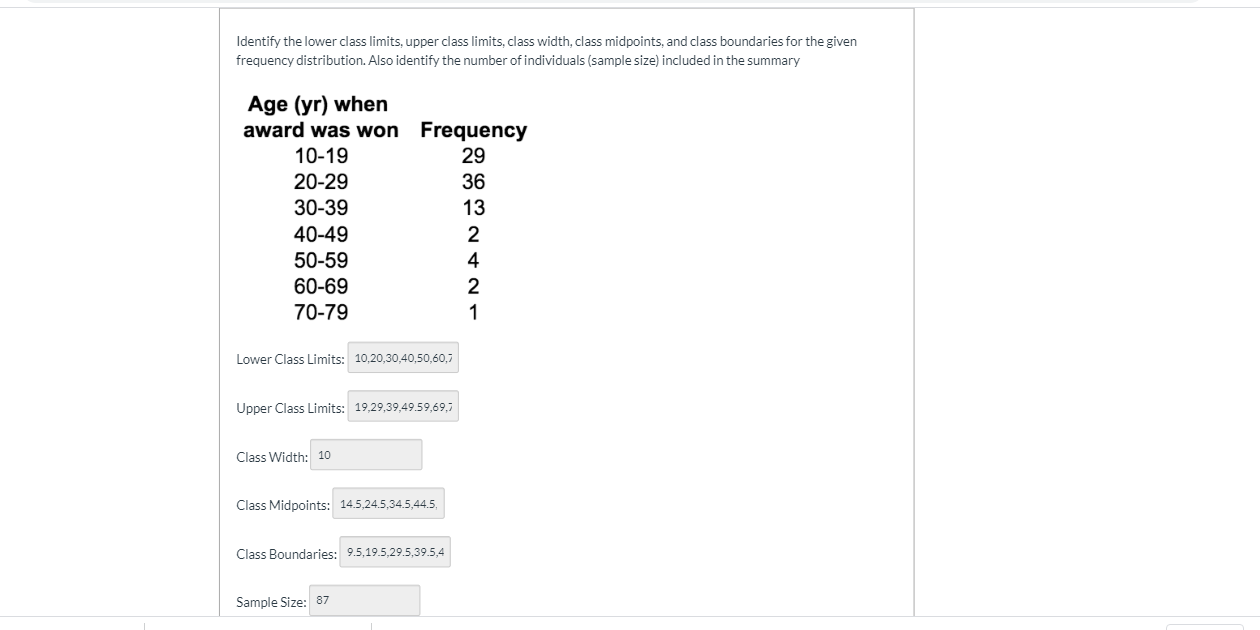
Incorrect Question 5 0/1 pts The histogram below represents the weights (in pounds) of members of a certain high-school programming team. How many members are included in the histogram? 6- 4- 2- 0- 110 120 130 140 150 160 170 15Identify the lower class limits, upper class limits, class width, class midpoints, and class boundaries for the given frequency distribution. Also identify the number of individuals (sample size) included in the summary Age (yr) when award was won Frequency 10-19 29 20-29 36 30-39 13 40-49 50-59 60-69 70-79 -NAN Lower Class Limits: 10,20,30,40,50,60,7 Upper Class Limits: 19,29,39,49.59,69,7 Class Width: 10 Class Midpoints: 14.5,24.5,34.5,44.5, Class Boundaries: 9.5,19.5,29.5,39.5,4 Sample Size: 87
Step by Step Solution
There are 3 Steps involved in it

Get step-by-step solutions from verified subject matter experts