

Question: help please omg its due at 11:59 The table below contains rainfall information in inches for each month of the years 2006 - 2010. Complete
help please omg its due at 11:59
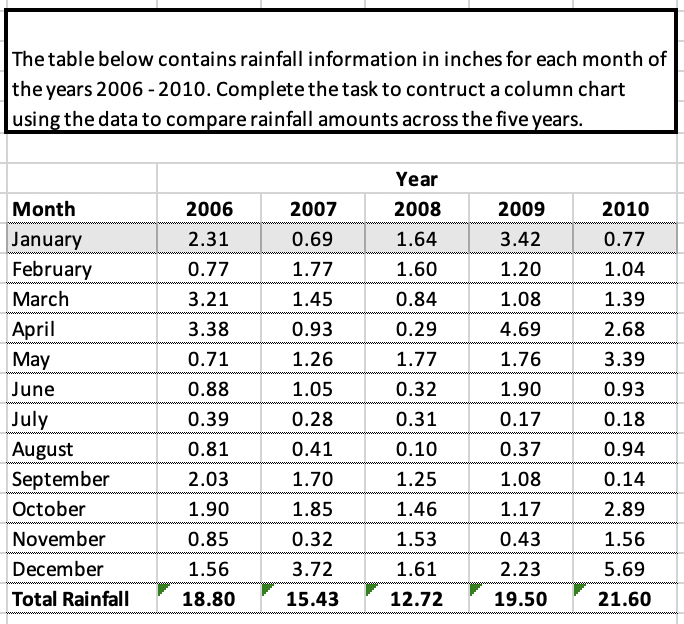

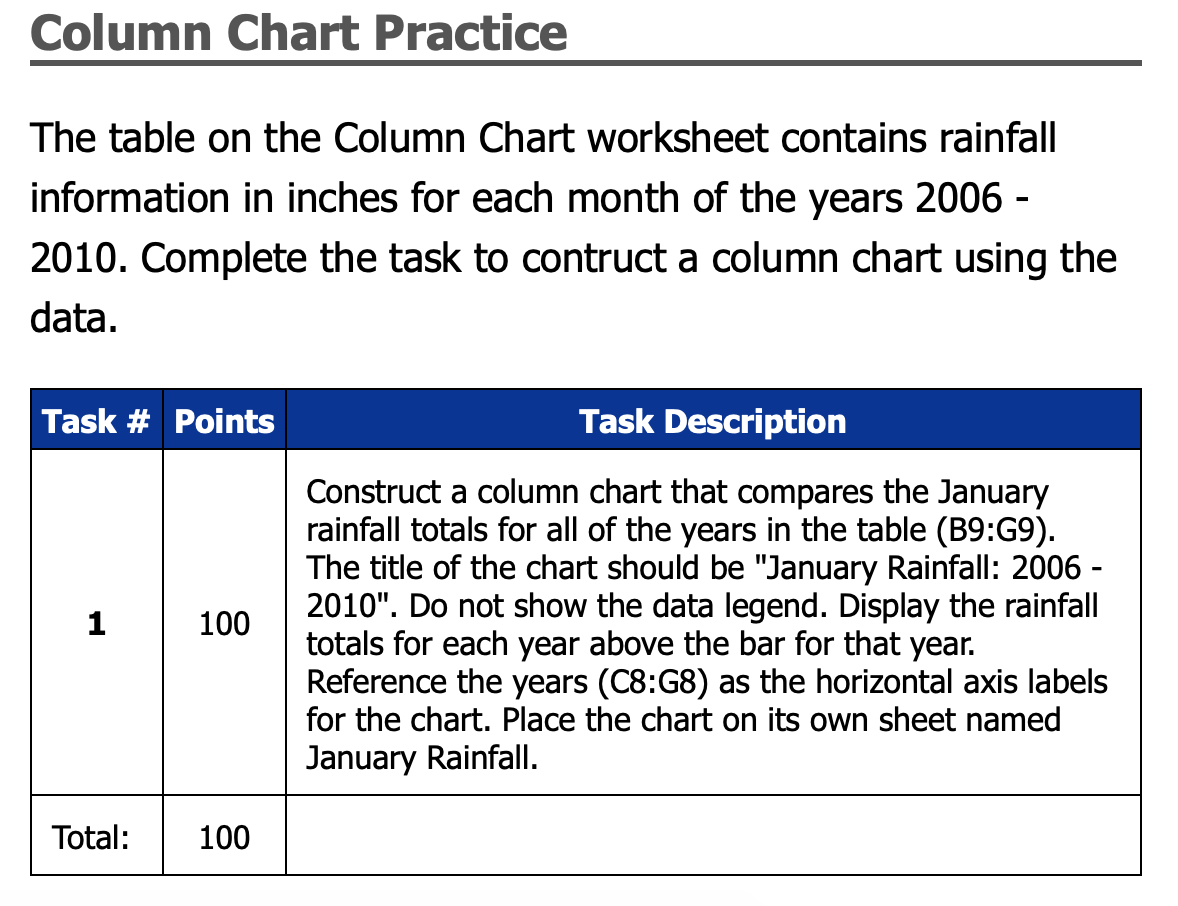
The table below contains rainfall information in inches for each month of the years 2006 - 2010. Complete the task to contructa column chart using the data to compare rainfall amounts across the five years. Year Month 2006 2007 2008 2009 2010 January 2.31 0.69 1.64 3.42 0.77 February 0.77 1.77 1.60 1.20 1.04 March 3.21 1.45 0.84 1.08 1.39 April 3.38 0.93 0.29 4.69 2.68 May 0.71 1.26 1.77 1.76 3.39 June 0.88 1.05 0.32 1.90 0.93 July 0.39 0.28 0.31 0.17 0.18 August 0.81 0.41 0.10 0.37 0.94 September 2.03 1.70 1.25 1.08 0.14 October 1.90 1.85 1.46 1.17 2.89 November 0.85 0.32 1.53 0.43 1.56 December 1.56 3.72 1.61 2.23 5.69 Total Rainfall 18.80 15.43 12.72 19.50 21.60Column Chart Practice The table on the Column Chart worksheet contains rainfall information in inches for each month of the years 2006 - 2010. Complete the task to contruct a column chart using the data. Task # Points Task Description Construct a column chart that compares the January rainfall totals for all of the years in the table (BQ:G9). The title of the chart should be "January Rainfall: 2006 2010". Do not show the data legend. Display the rainfall totals for each year above the bar for that year. Reference the years (C8:G8) as the horizontal axis labels for the chart. Place the chart on its own sheet named January Rainfall
Step by Step Solution
There are 3 Steps involved in it

Get step-by-step solutions from verified subject matter experts