

Question: help please the ones filled in are correct INCOME STATEMENT (Figures in $ millions) Net sales Cost of goods sold Other expenses Depreciation Earnings before
help please the ones filled in are correct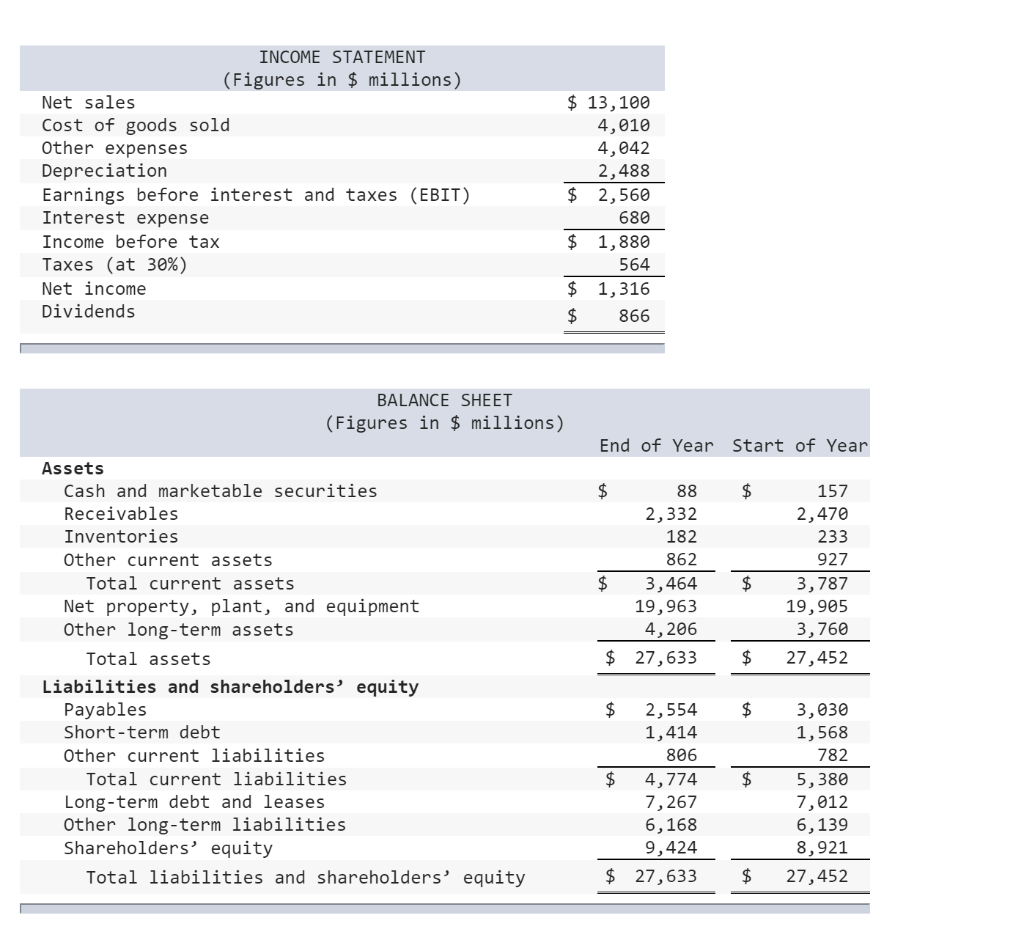
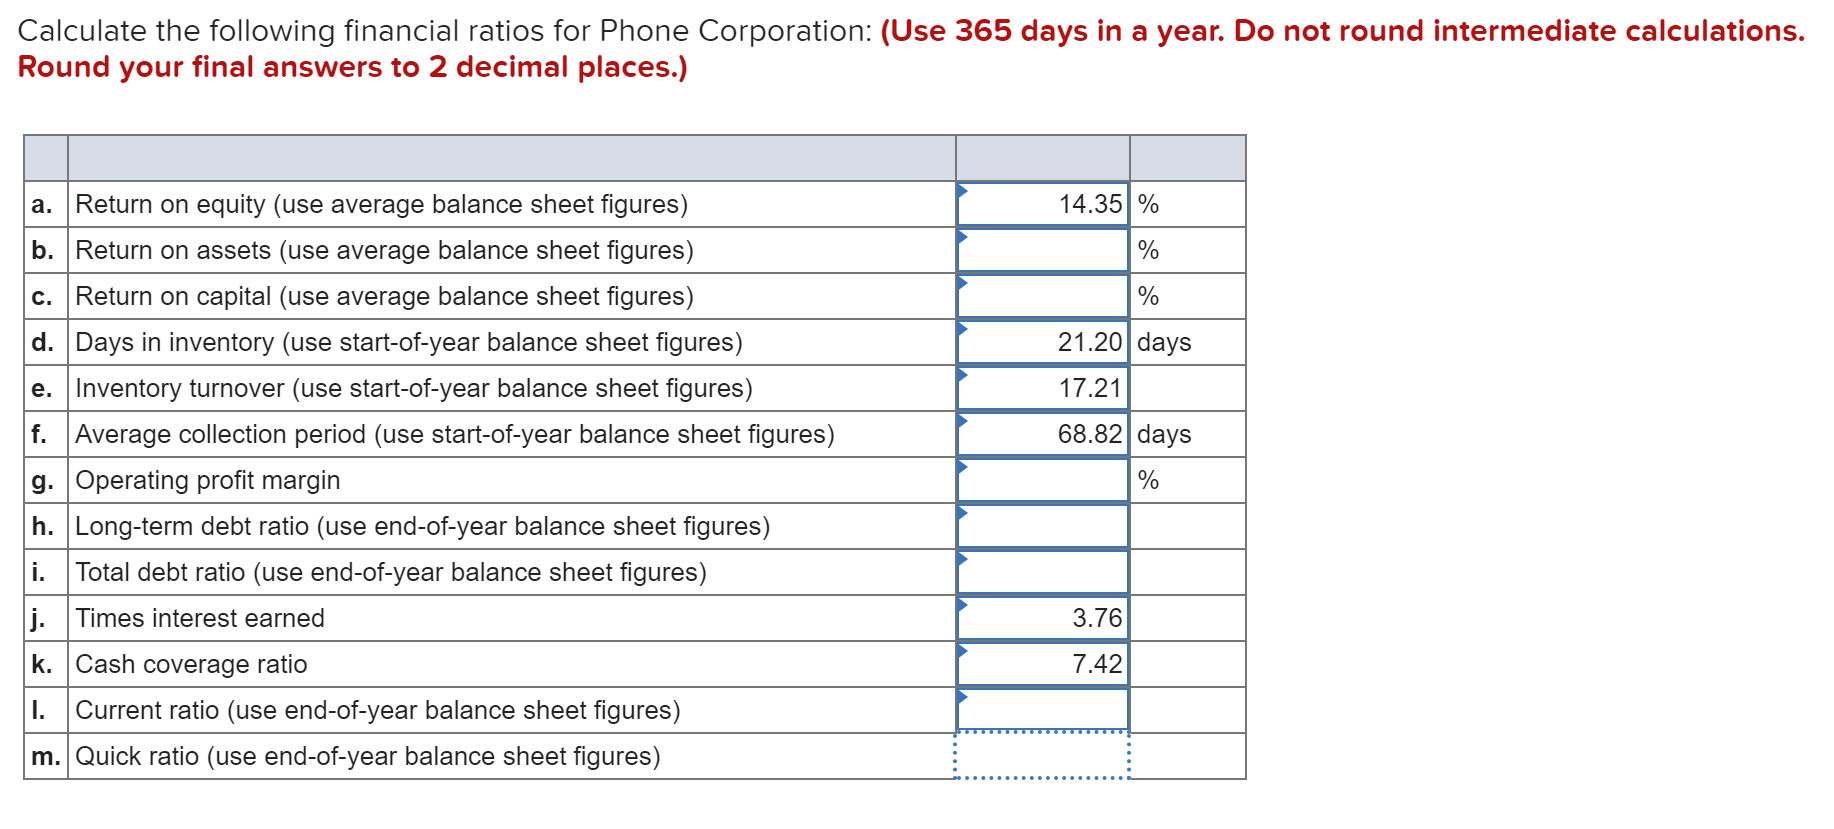
INCOME STATEMENT (Figures in $ millions) Net sales Cost of goods sold Other expenses Depreciation Earnings before interest and taxes (EBIT) Interest expense Income before tax Taxes (at 30%) Net income Dividends $ 13,100 4,010 4,042 2,488 $ 2,560 680 $ 1,880 564 $ 1,316 $ 866 BALANCE SHEET (Figures in $ millions) End of Year Start of Year $ $ 88 2,332 182 862 $ 3,464 19,963 4,206 $ 27,633 157 2,470 233 927 3,787 19,905 3,760 27,452 $ $ Assets Cash and marketable securities Receivables Inventories Other current assets Total current assets Net property, plant, and equipment Other long-term assets Total assets Liabilities and shareholders' equity Payables Short-term debt Other current liabilities Total current liabilities Long-term debt and leases Other long-term liabilities Shareholders' equity Total liabilities and shareholders' equity $ $ $ 2,554 1,414 806 $ 4,774 7,267 6,168 9,424 $ 27,633 3,030 1,568 782 5,380 7,012 6,139 8,921 27,452 $ Calculate the following financial ratios for Phone Corporation: (Use 365 days in a year. Do not round intermediate calculations. Round your final answers to 2 decimal places.) 14.35% % % 21.20 days 17.21 68.82 days a. Return on equity (use average balance sheet figures) b. Return on assets (use average balance sheet figures) c. Return on capital (use average balance sheet figures) d. Days in inventory (use start-of-year balance sheet figures) e. Inventory turnover (use start-of-year balance sheet figures) f. Average collection period (use start-of-year balance sheet figures) g. Operating profit margin h. Long-term debt ratio (use end-of-year balance sheet figures) i. Total debt ratio (use end-of-year balance sheet figures) j. Times interest earned k. Cash coverage ratio I. Current ratio (use end-of-year balance sheet figures) m. Quick ratio (use end-of-year balance sheet figures) % 3.76 7.42
Step by Step Solution
There are 3 Steps involved in it

Get step-by-step solutions from verified subject matter experts