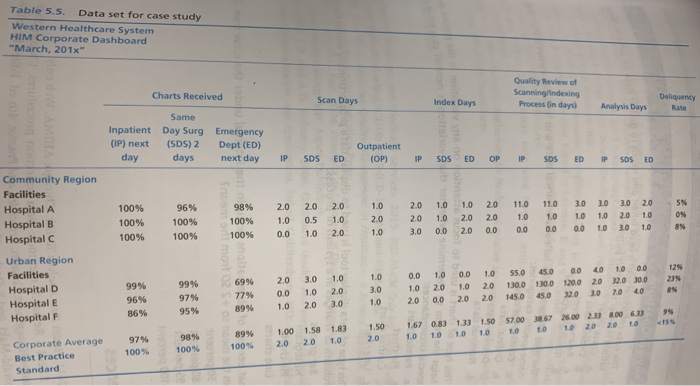
Question: help please with this case study! thank you! Case Study health information tha within Western Healthcar present the key indicator data are used by the

help please with this case study! thank you! help please with this case study! thank you! Case
help please with this case study! thank you! Case
Case Study health information tha within Western Healthcar present the key indicator data are used by the con hospital and across the co Indicatorsch Aby the COV blished a benchmark standard to rd for each the bottom of the repon in the corporation submits Table 5.5 is an example of a dashboard report showing the heal agement (HIM) department metrics of the six hospitals withi System for the month of March. The data presented represen performance for each hospital's HIM department. These data rate HIM Director to evaluate the performance of each hospita ration. Western Healthcare System has established a bench these key performance metrics, this is found in table 5.5 at the h labeled as "Best practice standard." Each hospital within the co monthly data to the Corporate HIM Director. Using these data, students should select three data ele create an appropriate graph to represent those data, along with th best practice standard for that data element. They should keep in data in the table and choose the best graphic display tool for those da students should answer the following questions about the data. om table 55 and with the corresponding een in mind the type of nose data. In addition, Case Study Questions 1. If you were the Corporate HIM Director for Western Healthcare System, what is your overall evaluation of the dashboard report for the month of March? Se cifically, which hospitals are not meeting several of your best practice standards based on the trends you are seeing in the data? 2. Based on your answer to question 1, what additional data would you request and what additional analysis would you perform? 3. Are there trends in any metrics across the corporation that are concerning? If so, which metrics and why are they of concern? Project Application Using the data collected from their quality improvement projects, studen select data to be displayed and determine the best graphic presentatio use a spreadsheet software program to design graphs for their projeces. Tojects, students should hic presentation. They should Table 5.5. Data set for case study Western Healthcare System HIM Corporate Dashboard "March, 2018" Quality Review of Scanning/indexing Process in days) Deliquency Rate Analysis Days Index Days Scan Days Charts Received Same Inpatient Day Surg (IP) next (SDS) 2 day days Emergency Dept (ED) next day SOSED Outpatient (OP) SOSED OP SDS SDS ED P ED P 5 on Community Region Facilities Hospital A Hospital B Hospital 96% 20 10 10 20 1.0 0.0 20 0.5 1.0 98% 100% 100% 100% 100% 100% 10 2.0 1.0 20 1.0 20 20 20 3. 0 30 30 30 10 10 20 00 10 20 110 10 00 110 10 00 10 10 20 1.0 2.0 2.0 00 20 00 100% 100% 10 000 20 320 30 20 40 55.0 45. 0 00 1300 1300 120.0 45.0 45.0 320 Urban Region Facilities Hospital D Hospital E Hospital F 99% 69% 77% 89% 99% 97% 95% 1000 100.0 1.0 3.0 10 20 10 20 1.0 2000 20 20 3.0 1.0 2.0 2.0 0.0 1.0 1.0 2.0 30 96% 86% 26.00 2.30 .33 10 20 20 10 37.00 10 10 38.67 10 10 1.33150 10 10 10 10 1.67 0.83 10 1.0 1.0 10 1.00 2.0 1.50 2.0 1.8) 1.0 1.58 2.0 89% 100% 97% 100% 98% 100% Corporate Average Best Practice Standard

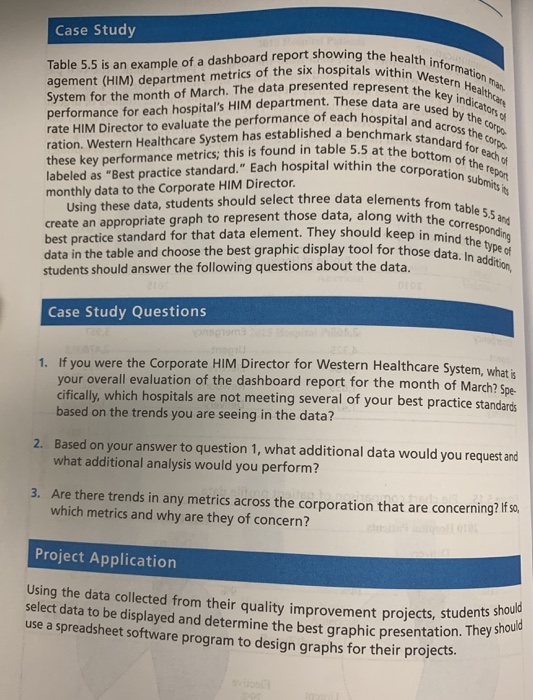
Step by Step Solution

There are 3 Steps involved in it

1 Expert Approved Answer
Step: 1 Unlock blur-text-image
Question Has Been Solved by an Expert!

Get step-by-step solutions from verified subject matter experts

Step: 2 Unlock
Step: 3 Unlock

Students Have Also Explored These Related General Management Questions!