

Question: help solve ( a , b , c ) using excel, pls show all work so i can understand Question 2 : Using the data
help solve abc using excel, pls show all work so i can understand Question : Using the data below, generate a simulation for a station queue similar to the
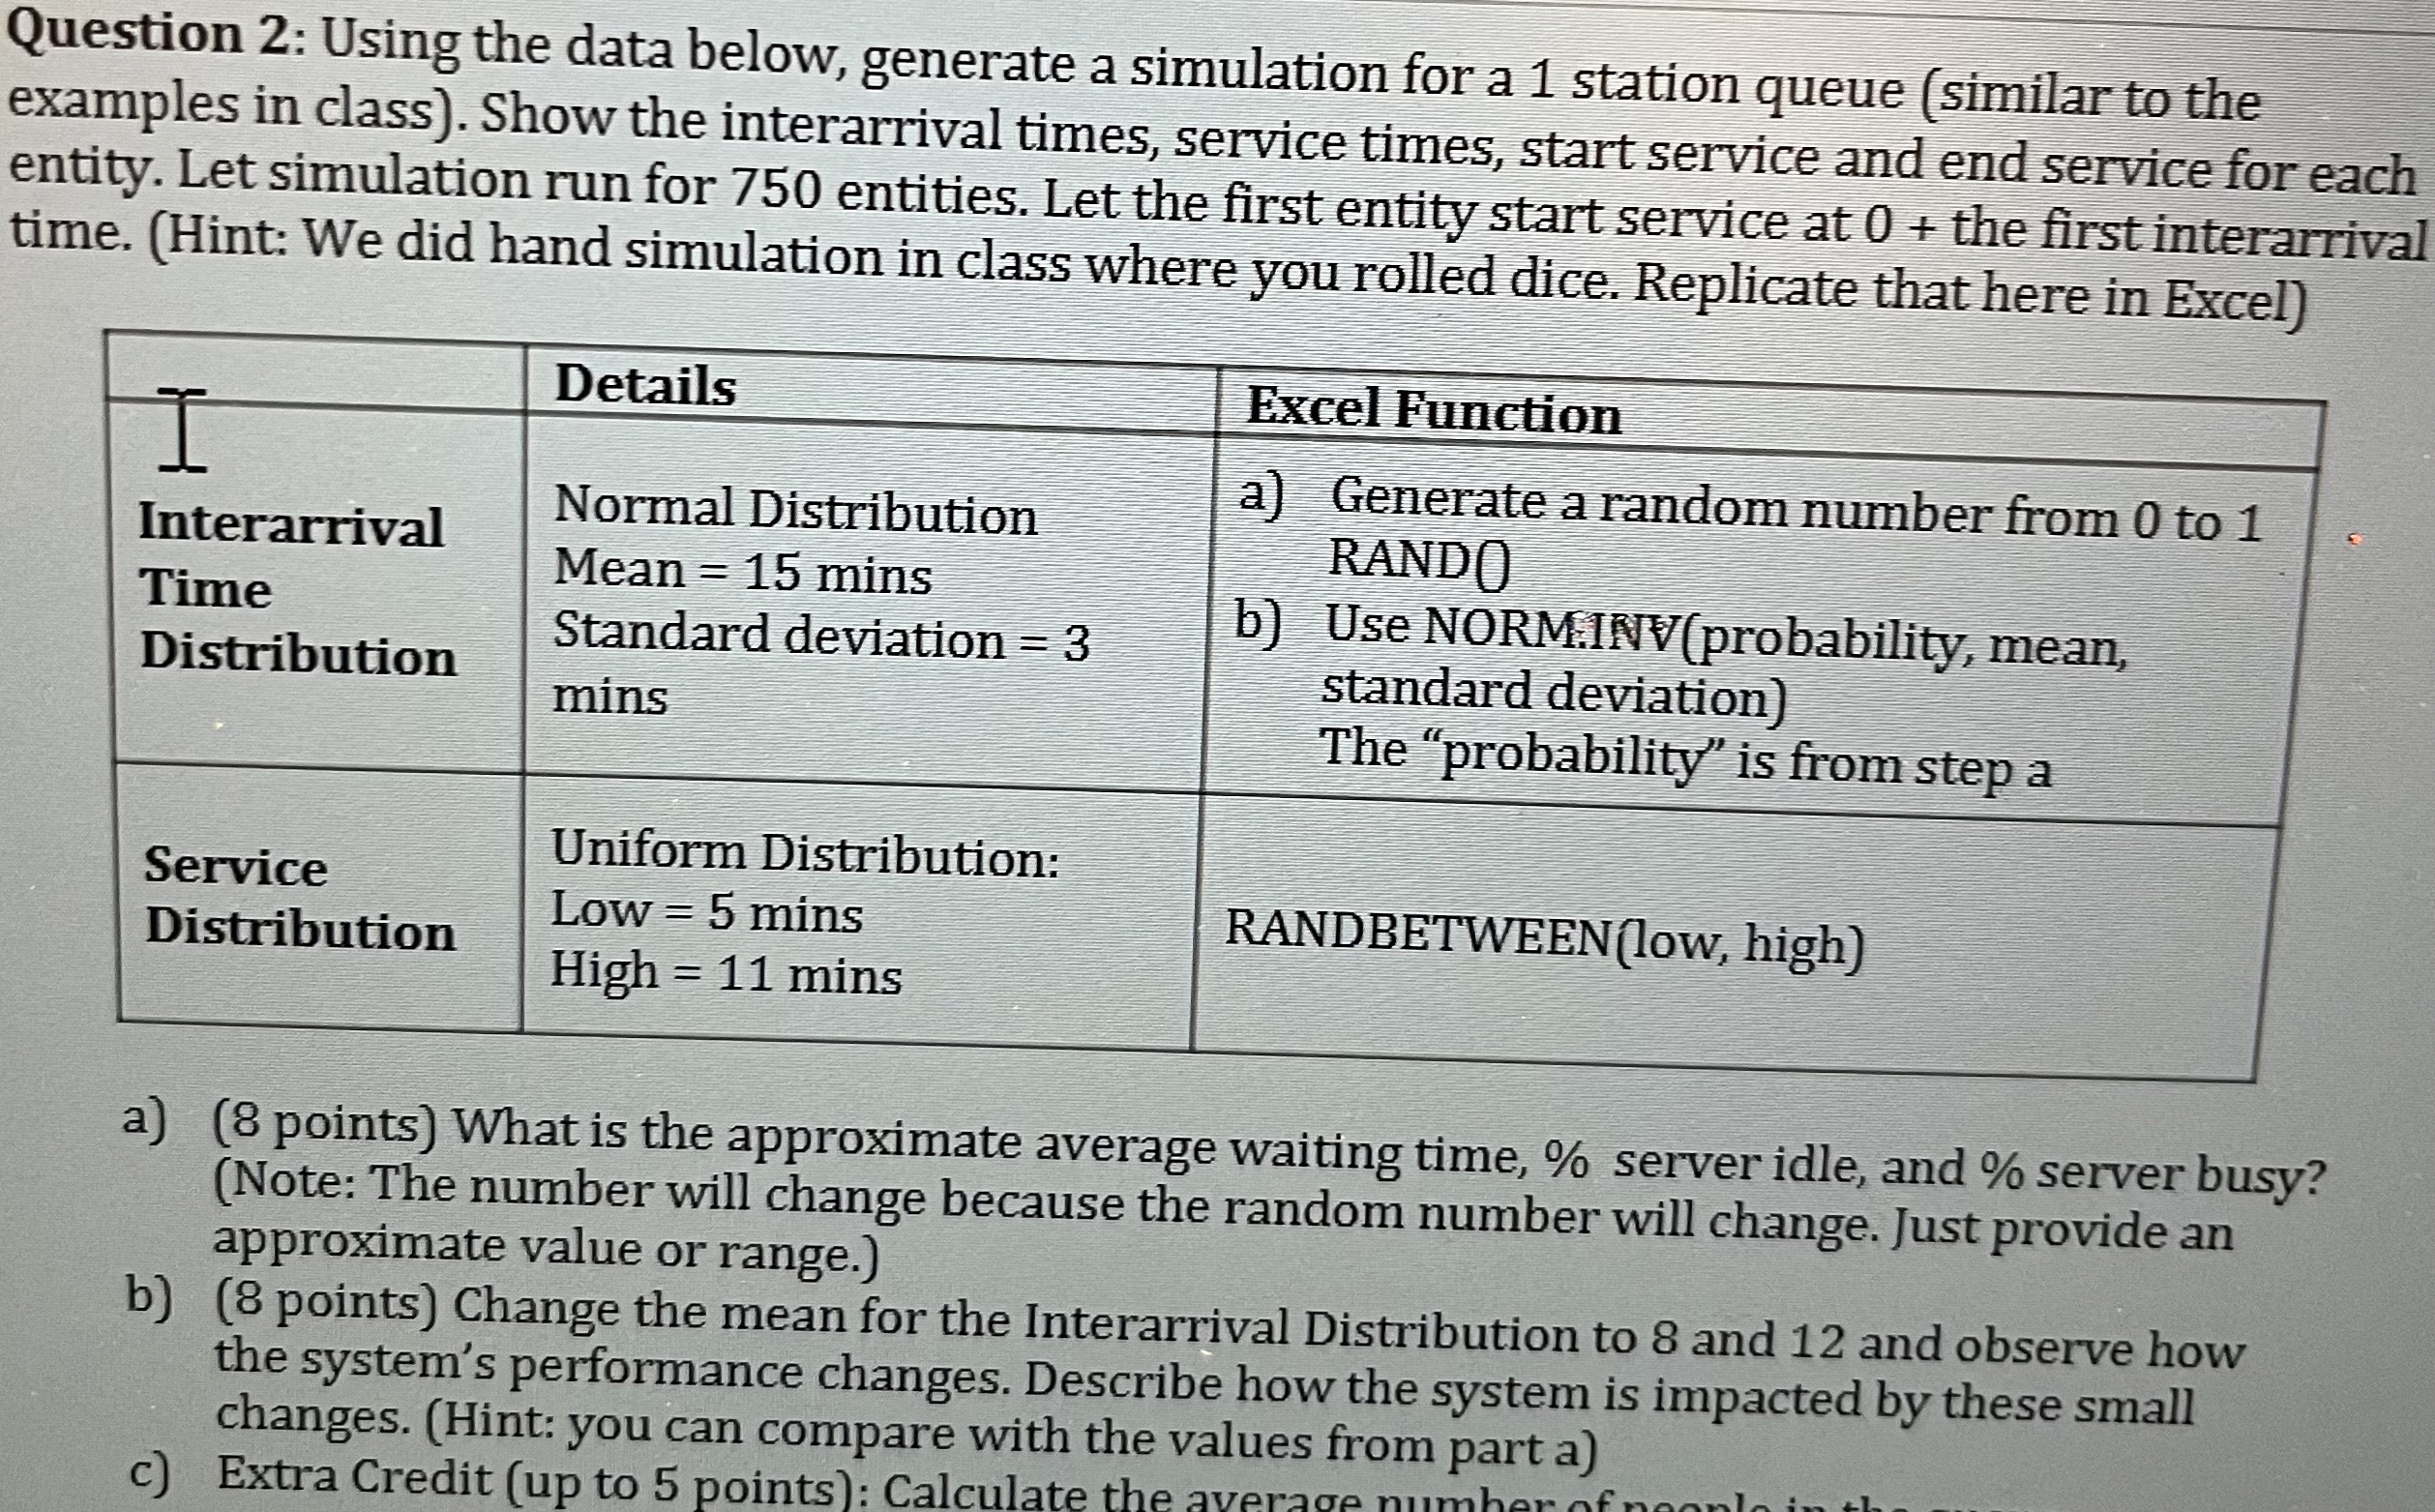
examples in class Show the interarrival times, service times, start service and end service for each
entity. Let simulation run for entities. Let the first entity start service at the first interarrival
time. Hint: We did hand simulation in class where you rolled dice. Replicate that here in Excel
a points What is the approximate average waiting time, server idle, and server busy?
Note: The number will change because the random number will change. Just provide an
approximate value or range.
b points Change the mean for the Interarrival Distribution to and and observe how
the system's performance changes. Describe how the system is impacted by these small
changes. Hint: you can compare with the values from part a
c Extra Credit up to points: Calculate the average numbor
Step by Step Solution
There are 3 Steps involved in it
1 Expert Approved Answer
Step: 1 Unlock

Question Has Been Solved by an Expert!
Get step-by-step solutions from verified subject matter experts
Step: 2 Unlock
Step: 3 Unlock