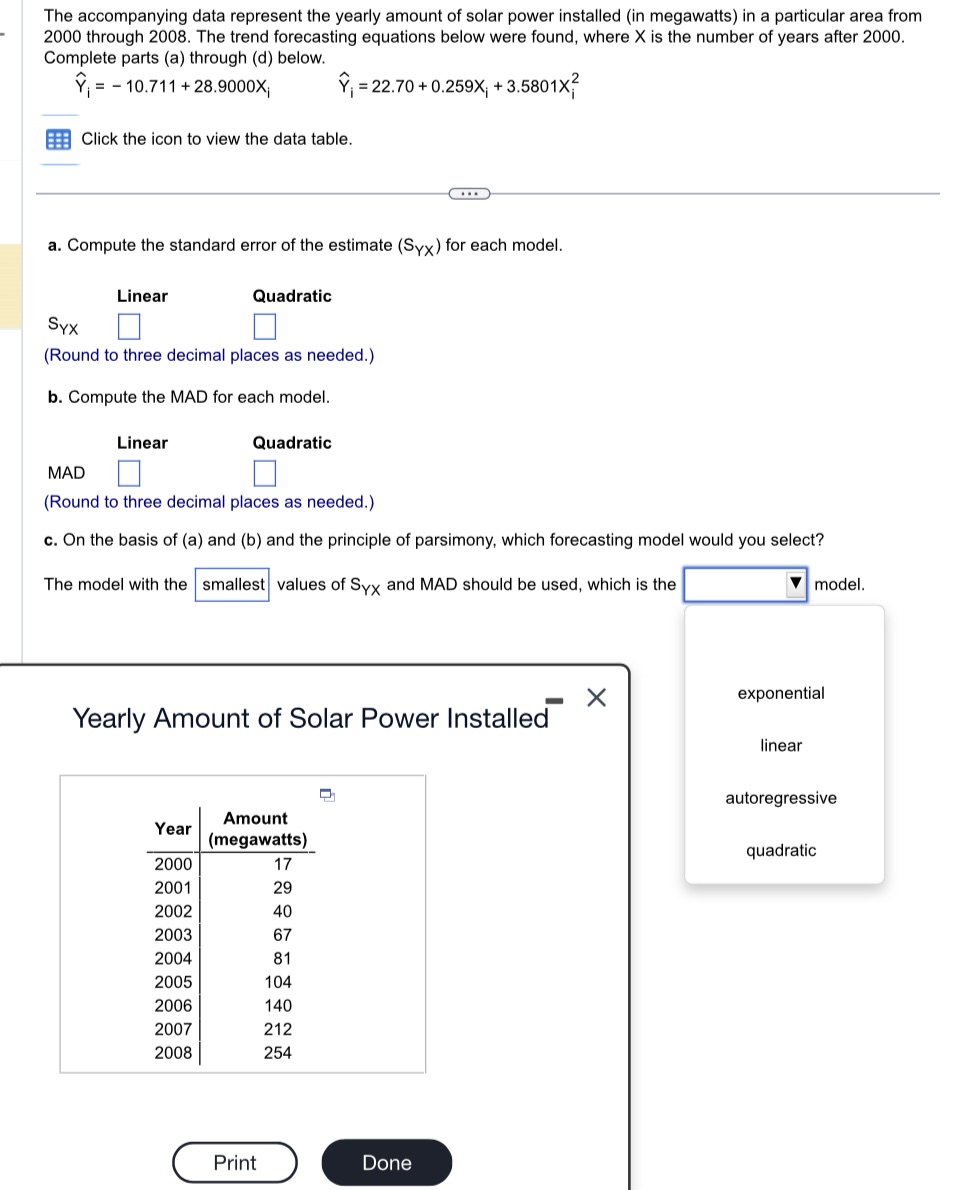
Question: Help solving a-c please! The accompanying data represent the yearly amount of solar power installed (in megawatts) in a particular area from 2000 through 2008.

Help solving a-c please!

Help solving a-c please! The accompanying data
The accompanying data represent the yearly amount of solar power installed (in megawatts) in a particular area from 2000 through 2008. The trend forecasting equations below were found, where X is the number of years after 2000. Complete parts (a) through (d) below. Y = - 10.711 + 28.9000X; Y, = 22.70 + 0.259X; + 3.5801X? Click the icon to view the data table. a. Compute the standard error of the estimate (Syx ) for each model. Linear Quadratic Syx 0 (Round to three decimal places as needed.) b. Compute the MAD for each model. Linear Quadratic MAD 0 (Round to three decimal places as needed.) c. On the basis of (a) and (b) and the principle of parsimony, which forecasting model would you select? The model with the smallest values of Syx and MAD should be used, which is the model. X exponential Yearly Amount of Solar Power Installed linear autoregressive Amount Year (megawatts) quadratic 2000 17 2001 29 2002 40 2003 67 2004 81 2005 104 2006 40 2007 212 2008 254 Print Done

Step by Step Solution

There are 3 Steps involved in it

1 Expert Approved Answer
Step: 1 Unlock blur-text-image
Question Has Been Solved by an Expert!

Get step-by-step solutions from verified subject matter experts

Step: 2 Unlock
Step: 3 Unlock

Students Have Also Explored These Related Mathematics Questions!