

Question: The answer should be rounded to three decimal places The accompanying data represent the yearly amount of solar power installed (in megawatts) in a particular
The answer should be rounded to three decimal places
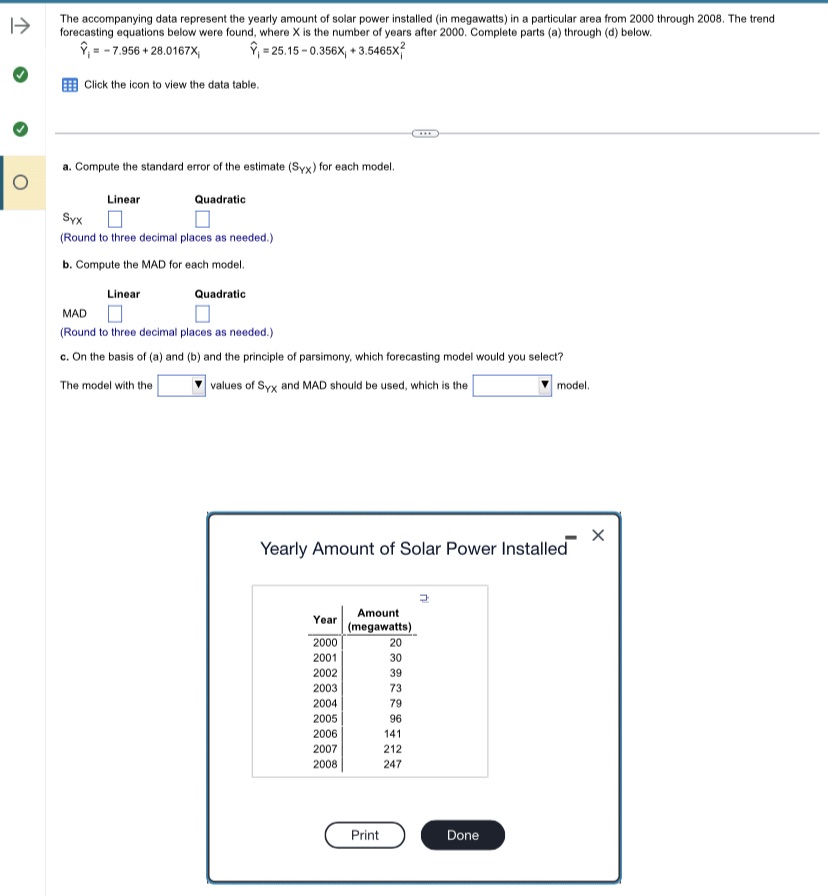
The accompanying data represent the yearly amount of solar power installed (in megawatts) in a particular area from 2000 through 2008. The trend forecasting equations below were found, where X is the number of years after 2000. Complete parts (a) through (d) below. Y, = - 7.956 + 28.0167X Y, = 25.15 - 0.356X, + 3.5465X Click the icon to view the data table. a. Compute the standard error of the estimate (Syx ) for each model. O Linear Quadratic Syx (Round to three decimal places as needed.) b. Compute the MAD for each model. Linear Quadratic MAD (Round to three decimal places as needed.) c. On the basis of (a) and (b) and the principle of parsimony, which forecasting model would you select? The model with the values of Syx and MAD should be used, which is the model. Yearly Amount of Solar Power Installed X Year Amount (megawatts) 2000 20 2001 30 2002 39 2003 73 2004 79 2005 96 2006 141 2007 212 2008 247 Print Done
Step by Step Solution
There are 3 Steps involved in it

Get step-by-step solutions from verified subject matter experts