

Question: help solving this 3 problems pls. it has no balance sheet ((( O Search Part 1 Analysis of Financial Statements and Market Values Instruction: You
help solving this 3 problems pls.
it has no balance sheet (((
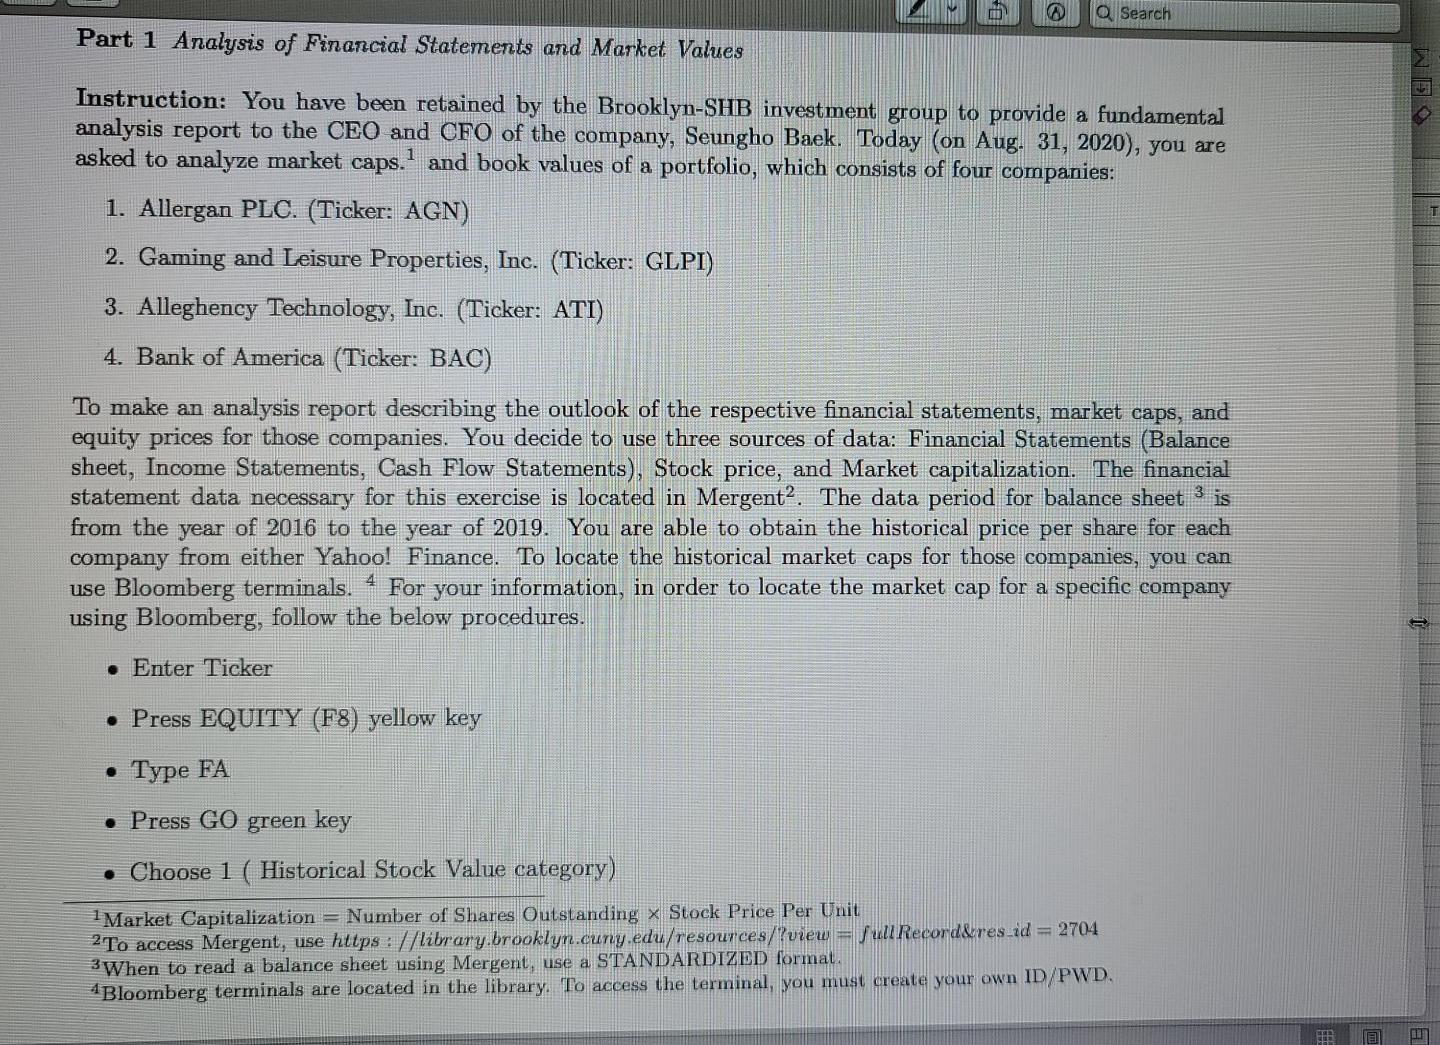
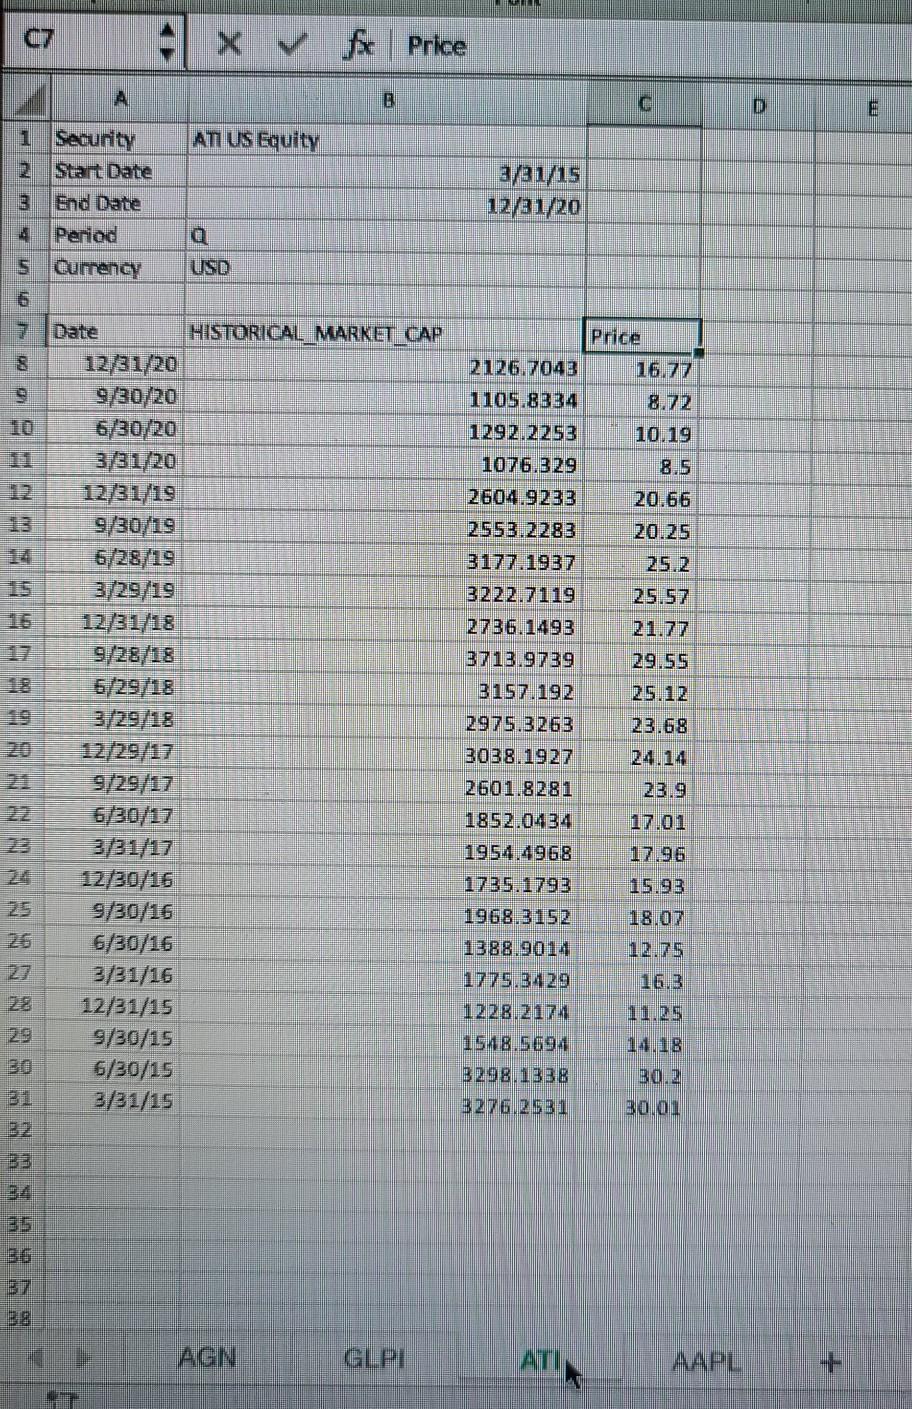
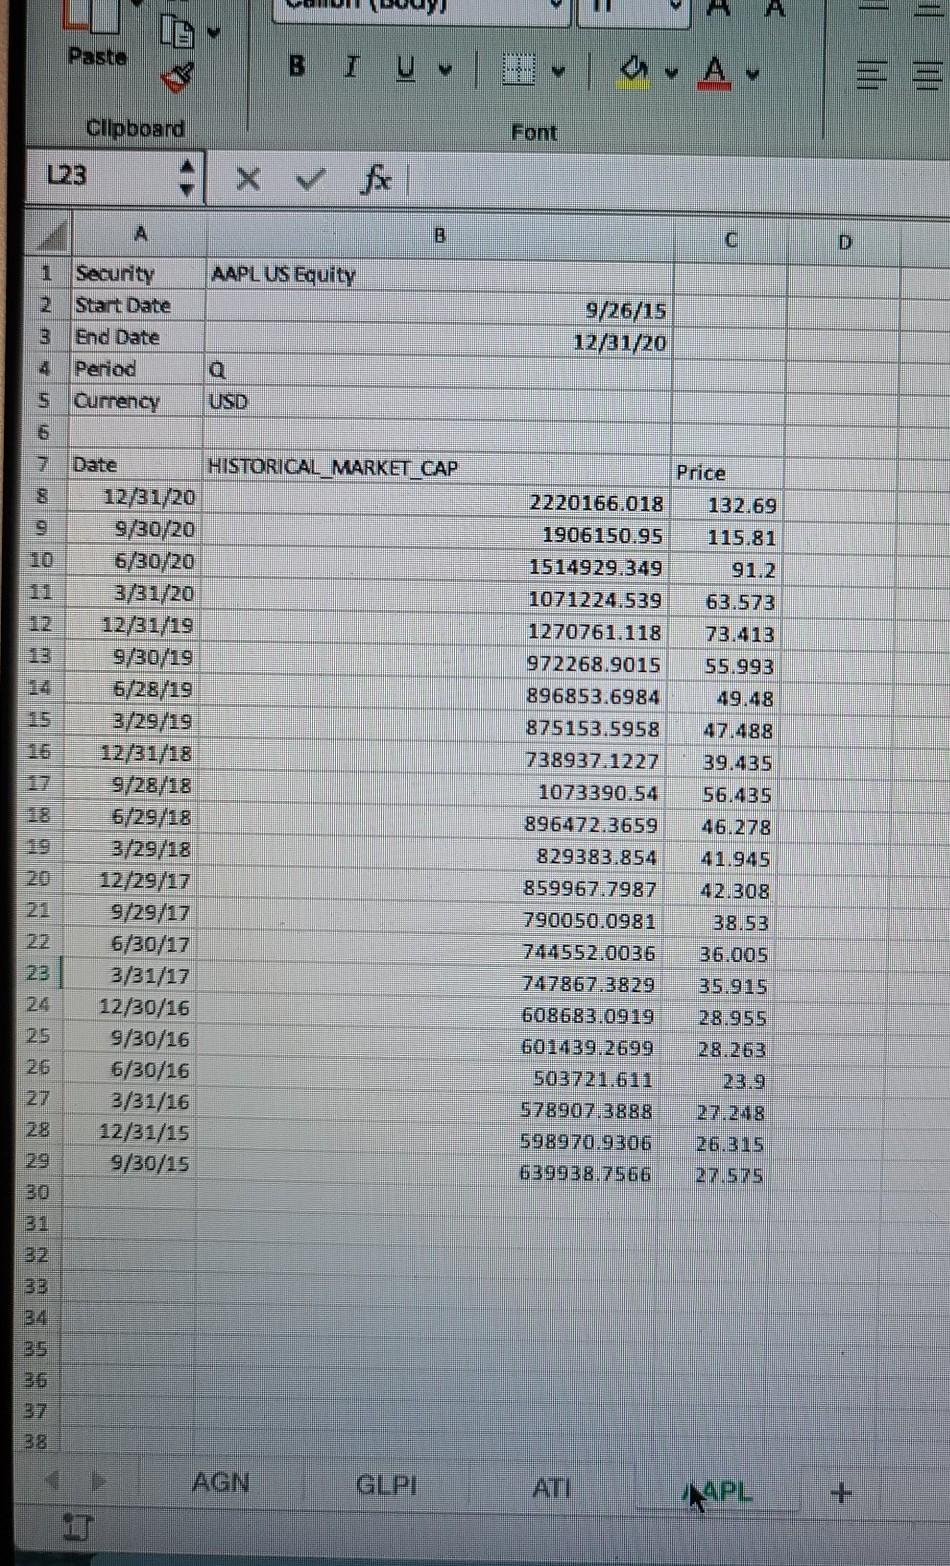
O Search Part 1 Analysis of Financial Statements and Market Values Instruction: You have been retained by the Brooklyn-SHB investment group to provide a fundamental analysis report to the CEO and CFO of the company, Seungho Baek. Today (on Aug. 31, 2020), you are asked to analyze market caps.? and book values of a portfolio, which consists of four companies: 1. Allergan PLC. (Ticker: AGN) 2. Gaming and Leisure Properties, Inc. (Ticker: GLPI) 3. Alleghency Technology, Inc. (Ticker: ATI) 4. Bank of America (Ticker: BAC) To make an analysis report describing the outlook of the respective financial statements, market caps, and equity prices for those companies. You decide to use three sources of data: Financial Statements (Balance sheet, Income Statements, Cash Flow Statements), Stock price, and Market capitalization. The financial statement data necessary for this exercise is located in Mergent2. The data period for balance sheet 3 is from the year of 2016 to the year of 2019. You are able to obtain the historical price per share for each company from either Yahoo! Finance. To locate the historical market caps for those companies, you can use Bloomberg terminals. - For your information, in order to locate the market cap for a specific company using Bloomberg, follow the below procedures. Enter Ticker Press EQUITY (F8) yellow key . Type FA Press GO green key Choose 1 ( Historical Stock Value category) Market Capitalization = Number of Shares Outstanding x Stock Price Per Unit 2To access Mergent, use https://library.brooklyn.cuny.edu/resources/view = full Record&res_id = 2704 3 When to read a balance sheet using Mergent, use a STANDARDIZED formal. 4Bloomberg terminals are located in the library. To access the terminal, you must create your own ID/PWD. Search 5 Problem 1. Now you would like to see a trend of total assets, total liabilities, total shareholders equities, stock prices, and market caps for each individual company from the year of 2016 to the year of 2019. Create a table that describes total assets, liabilities, shareholders' equities, market caps, and stock prices over the time period and report your findings. Problem 2. Also, you would like to check each company's liquidity and pay-ability. So you are planning to report all the assets classified as current assets and all the liabilities classified as current liabilities on yearly basis. Make a table that documents all the assets and all the liabilities during the period. In addition, create a table provides all the assets which are expressed as a percentage of total current assets and all the liabilities that are expressed as a percentage of total current liabilities. Interpret all the numbers and report your findings. Problem 3. To see roughly how much each of companies holds cash to operate its business so as to take care of an contingent event, you want calculate yearly net working capitals for all those companies and then you want to compare them to short-term and long-term debts.? Report a table summarizes yearly net working capitals, short-term debts, and long-term debts and document your findings thoroughly. FOSCA B I A Cipboard Font Prime B C AGNUS Equity 1 Security Start Date End Date 4 Period 5 Cumency 3/31/15 6/30/20 USD 5 HISTORICAL MARKET CAP 6/30/20 NN/AN/A 3/31/20 12,31/19 930/19 6/28/19 3/29/19 12/31/18 9/28/18 6/29/18 3/29/18 Price 193.02 58389.87 62818.462 191.17 55215.949 168.29 54900.297 167.43 48695.966 146.41 44134.532 133.66 64229.856 190.48 55050.944 166.72 57050.31 168.29 54014.116 163.58 68637.755 204.95 81216.369 243.09 80014.308 238.92 70332.349 210101 87863 265 230.31 91165.005 231.09 105979.062 268.03 123281.25 312.5 72274.279 80590.011 303.46 79137.158 29702 3/31/17 12,130/16 630/16 3131/16 12/31/15 9/30/15 6/30/15 3/31/15 AGN AAPL F LI Calibri (Body) 11 A A 10 Pasto B T Clipboard Font C7 X fc Price A B C 3/31/15 12/31/20 1 Security GLPI US Equity 2 Start Date 3 End Date 4 Period 5 Currency USD 6 7 Date HISTORICAL_MARKET_CAP 12/31/20 9 9/30/20 10 6/30/20 3/31/20 12/31/19 9/30/19 6/28/19 3/29/19 12/31/18 9/28/18 6/29/18 3/29/18 12/29/17 9/29/17 6/30/17 3/31/17 24 12/30/16 9/30/16 6/30/16 3/31/16 12/31/15 29 9/30/15 6/30/15 3/31/15 32 Price 9855.9741 42.4 8150.3449 36.93 7536.6148 34.6 5960.6213 27.71 9242.5838 43.05 8209.4724 38.24 8367.9588 38.98 8278.8769 38.57 5921.1875 32 31 7544.8393 35.25 7651 8182 35.8 7145.7864 33.47 7870.5493 37 7842.936 36.89 7994.2466 37.67 6955.9505 33.42 6359.0644 30.62 6927.9974 33.45 7013.6737 34.48 3618.5034 30.92 3213.5221 27.8 3405.6489 29.7 4194.3833 36.66 4211.0557 36.87 AGN GLPI ATI AAPL 721,609 XV fx | Price D 3/31/15 12/31/20 1 Security ATI US Equity 2 Start Date 3 End Date 4 Period a 5 Currency USD 6 7 Date HISTORICAL MARKET CAP 8 12/31/20 9/30/20 6/30/20 3/31/20 12/31/19 9/30/19 6/28/19 3/29/19 12/31/18 9/28/18 6/29/18 3/29/18 12/29/17 9/29/17 6/30/17 3/31/17 12/30/16 9/30/16 6/30/16 3/31/16 12/31/15 9/30/15 6/30/15 3/31/15 Price 2126.7043 1105.8334 1292.2253 10.19 1076.329 2604.9233 20.66 2553.2283 20.25 3177.1937 25.2 3222.7119 25.57 2736.1493 21.77 3713.9739 29.55 3157.192 2975.3263 23.68 3038.1927 24.14 2601.8281 1852.0434 1954.4968 1735.1793 15.93 1968.3152 18.07 1388.9014 12.75 1775.3429 :::: 1228.2174 1548.5694 3298.1338 3276.2531 30.2 30.01 AGN GLPI ATI Paste B I U3 | OA Clipboard Font D AAPLUS Equity 1 Security Start Date End Date 4 Period 5 Currency 9/26/15 12/31/20 Q USD Price [ 4 m 7 # \ " 2220166.018 1906150.95 1514929.349 1071224.539 1270761.118 972268.9015 896853.6984 132.69 115.81 91.2 63.573 73.413 55.993 49.48 47 488 875153.5958 738937.1227 39.435 56.435 Date HISTORICAL MARKET CAP 12/31/20 9/30/20 6/30/20 3/31/20 12/31/19 9/30/19 6/28/19 3/29/19 12/31/18 9/28/18 6/29/18 3/29/18 12/29/17 9/29/17 6/30/17 3/31/17 12/30/16 9/30/16 6/30/16 3/31/16 12/31/15 9/30/15 1073390.54 896472.3659 46.278 41.945 42.308 38.53 36.005 35.915 829383.854 859967.7987 790050.0981 744552.0036 7478673829 608683.0919 601439.2699 503721.611 578907.3888 598970.9306 639938.7556 28.955 28.263 27 27.248 26.315 09 ao AGN GLPI ATI AAPL O Search Part 1 Analysis of Financial Statements and Market Values Instruction: You have been retained by the Brooklyn-SHB investment group to provide a fundamental analysis report to the CEO and CFO of the company, Seungho Baek. Today (on Aug. 31, 2020), you are asked to analyze market caps.? and book values of a portfolio, which consists of four companies: 1. Allergan PLC. (Ticker: AGN) 2. Gaming and Leisure Properties, Inc. (Ticker: GLPI) 3. Alleghency Technology, Inc. (Ticker: ATI) 4. Bank of America (Ticker: BAC) To make an analysis report describing the outlook of the respective financial statements, market caps, and equity prices for those companies. You decide to use three sources of data: Financial Statements (Balance sheet, Income Statements, Cash Flow Statements), Stock price, and Market capitalization. The financial statement data necessary for this exercise is located in Mergent2. The data period for balance sheet 3 is from the year of 2016 to the year of 2019. You are able to obtain the historical price per share for each company from either Yahoo! Finance. To locate the historical market caps for those companies, you can use Bloomberg terminals. - For your information, in order to locate the market cap for a specific company using Bloomberg, follow the below procedures. Enter Ticker Press EQUITY (F8) yellow key . Type FA Press GO green key Choose 1 ( Historical Stock Value category) Market Capitalization = Number of Shares Outstanding x Stock Price Per Unit 2To access Mergent, use https://library.brooklyn.cuny.edu/resources/view = full Record&res_id = 2704 3 When to read a balance sheet using Mergent, use a STANDARDIZED formal. 4Bloomberg terminals are located in the library. To access the terminal, you must create your own ID/PWD. Search 5 Problem 1. Now you would like to see a trend of total assets, total liabilities, total shareholders equities, stock prices, and market caps for each individual company from the year of 2016 to the year of 2019. Create a table that describes total assets, liabilities, shareholders' equities, market caps, and stock prices over the time period and report your findings. Problem 2. Also, you would like to check each company's liquidity and pay-ability. So you are planning to report all the assets classified as current assets and all the liabilities classified as current liabilities on yearly basis. Make a table that documents all the assets and all the liabilities during the period. In addition, create a table provides all the assets which are expressed as a percentage of total current assets and all the liabilities that are expressed as a percentage of total current liabilities. Interpret all the numbers and report your findings. Problem 3. To see roughly how much each of companies holds cash to operate its business so as to take care of an contingent event, you want calculate yearly net working capitals for all those companies and then you want to compare them to short-term and long-term debts.? Report a table summarizes yearly net working capitals, short-term debts, and long-term debts and document your findings thoroughly. FOSCA B I A Cipboard Font Prime B C AGNUS Equity 1 Security Start Date End Date 4 Period 5 Cumency 3/31/15 6/30/20 USD 5 HISTORICAL MARKET CAP 6/30/20 NN/AN/A 3/31/20 12,31/19 930/19 6/28/19 3/29/19 12/31/18 9/28/18 6/29/18 3/29/18 Price 193.02 58389.87 62818.462 191.17 55215.949 168.29 54900.297 167.43 48695.966 146.41 44134.532 133.66 64229.856 190.48 55050.944 166.72 57050.31 168.29 54014.116 163.58 68637.755 204.95 81216.369 243.09 80014.308 238.92 70332.349 210101 87863 265 230.31 91165.005 231.09 105979.062 268.03 123281.25 312.5 72274.279 80590.011 303.46 79137.158 29702 3/31/17 12,130/16 630/16 3131/16 12/31/15 9/30/15 6/30/15 3/31/15 AGN AAPL F LI Calibri (Body) 11 A A 10 Pasto B T Clipboard Font C7 X fc Price A B C 3/31/15 12/31/20 1 Security GLPI US Equity 2 Start Date 3 End Date 4 Period 5 Currency USD 6 7 Date HISTORICAL_MARKET_CAP 12/31/20 9 9/30/20 10 6/30/20 3/31/20 12/31/19 9/30/19 6/28/19 3/29/19 12/31/18 9/28/18 6/29/18 3/29/18 12/29/17 9/29/17 6/30/17 3/31/17 24 12/30/16 9/30/16 6/30/16 3/31/16 12/31/15 29 9/30/15 6/30/15 3/31/15 32 Price 9855.9741 42.4 8150.3449 36.93 7536.6148 34.6 5960.6213 27.71 9242.5838 43.05 8209.4724 38.24 8367.9588 38.98 8278.8769 38.57 5921.1875 32 31 7544.8393 35.25 7651 8182 35.8 7145.7864 33.47 7870.5493 37 7842.936 36.89 7994.2466 37.67 6955.9505 33.42 6359.0644 30.62 6927.9974 33.45 7013.6737 34.48 3618.5034 30.92 3213.5221 27.8 3405.6489 29.7 4194.3833 36.66 4211.0557 36.87 AGN GLPI ATI AAPL 721,609 XV fx | Price D 3/31/15 12/31/20 1 Security ATI US Equity 2 Start Date 3 End Date 4 Period a 5 Currency USD 6 7 Date HISTORICAL MARKET CAP 8 12/31/20 9/30/20 6/30/20 3/31/20 12/31/19 9/30/19 6/28/19 3/29/19 12/31/18 9/28/18 6/29/18 3/29/18 12/29/17 9/29/17 6/30/17 3/31/17 12/30/16 9/30/16 6/30/16 3/31/16 12/31/15 9/30/15 6/30/15 3/31/15 Price 2126.7043 1105.8334 1292.2253 10.19 1076.329 2604.9233 20.66 2553.2283 20.25 3177.1937 25.2 3222.7119 25.57 2736.1493 21.77 3713.9739 29.55 3157.192 2975.3263 23.68 3038.1927 24.14 2601.8281 1852.0434 1954.4968 1735.1793 15.93 1968.3152 18.07 1388.9014 12.75 1775.3429 :::: 1228.2174 1548.5694 3298.1338 3276.2531 30.2 30.01 AGN GLPI ATI Paste B I U3 | OA Clipboard Font D AAPLUS Equity 1 Security Start Date End Date 4 Period 5 Currency 9/26/15 12/31/20 Q USD Price [ 4 m 7 # \ " 2220166.018 1906150.95 1514929.349 1071224.539 1270761.118 972268.9015 896853.6984 132.69 115.81 91.2 63.573 73.413 55.993 49.48 47 488 875153.5958 738937.1227 39.435 56.435 Date HISTORICAL MARKET CAP 12/31/20 9/30/20 6/30/20 3/31/20 12/31/19 9/30/19 6/28/19 3/29/19 12/31/18 9/28/18 6/29/18 3/29/18 12/29/17 9/29/17 6/30/17 3/31/17 12/30/16 9/30/16 6/30/16 3/31/16 12/31/15 9/30/15 1073390.54 896472.3659 46.278 41.945 42.308 38.53 36.005 35.915 829383.854 859967.7987 790050.0981 744552.0036 7478673829 608683.0919 601439.2699 503721.611 578907.3888 598970.9306 639938.7556 28.955 28.263 27 27.248 26.315 09 ao AGN GLPI ATI AAPL
Step by Step Solution
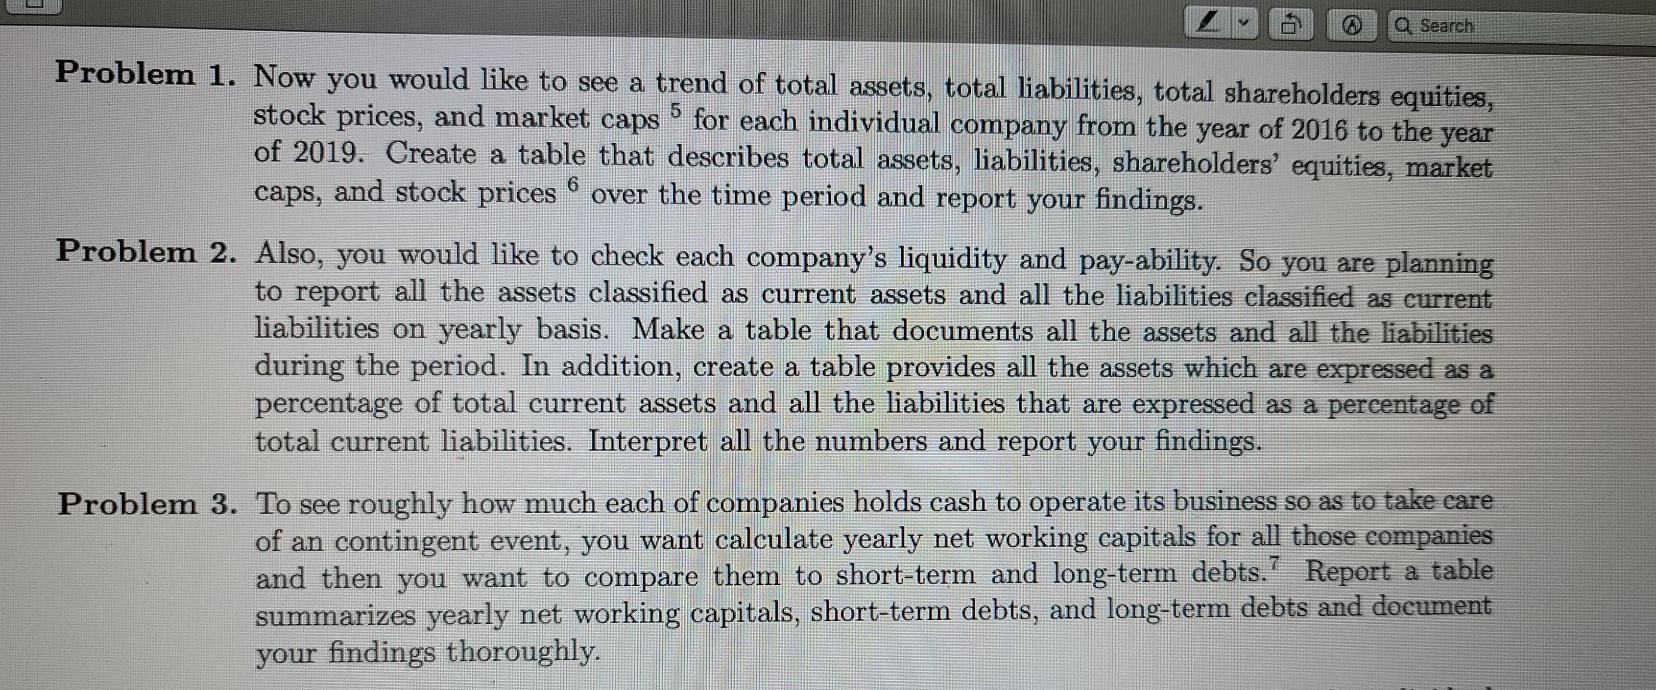
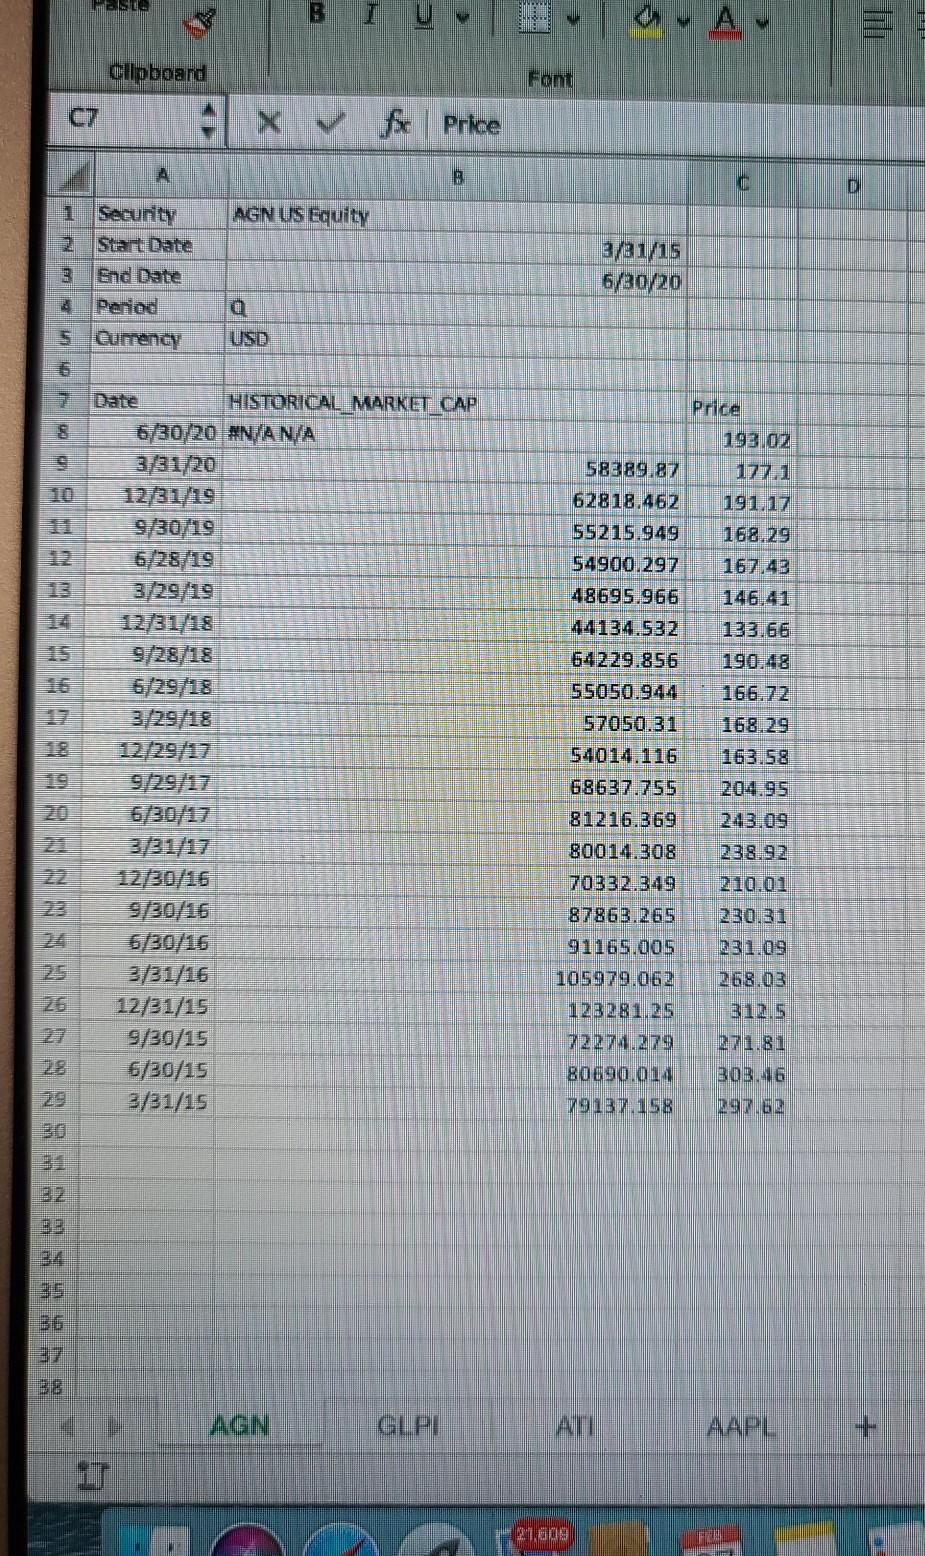
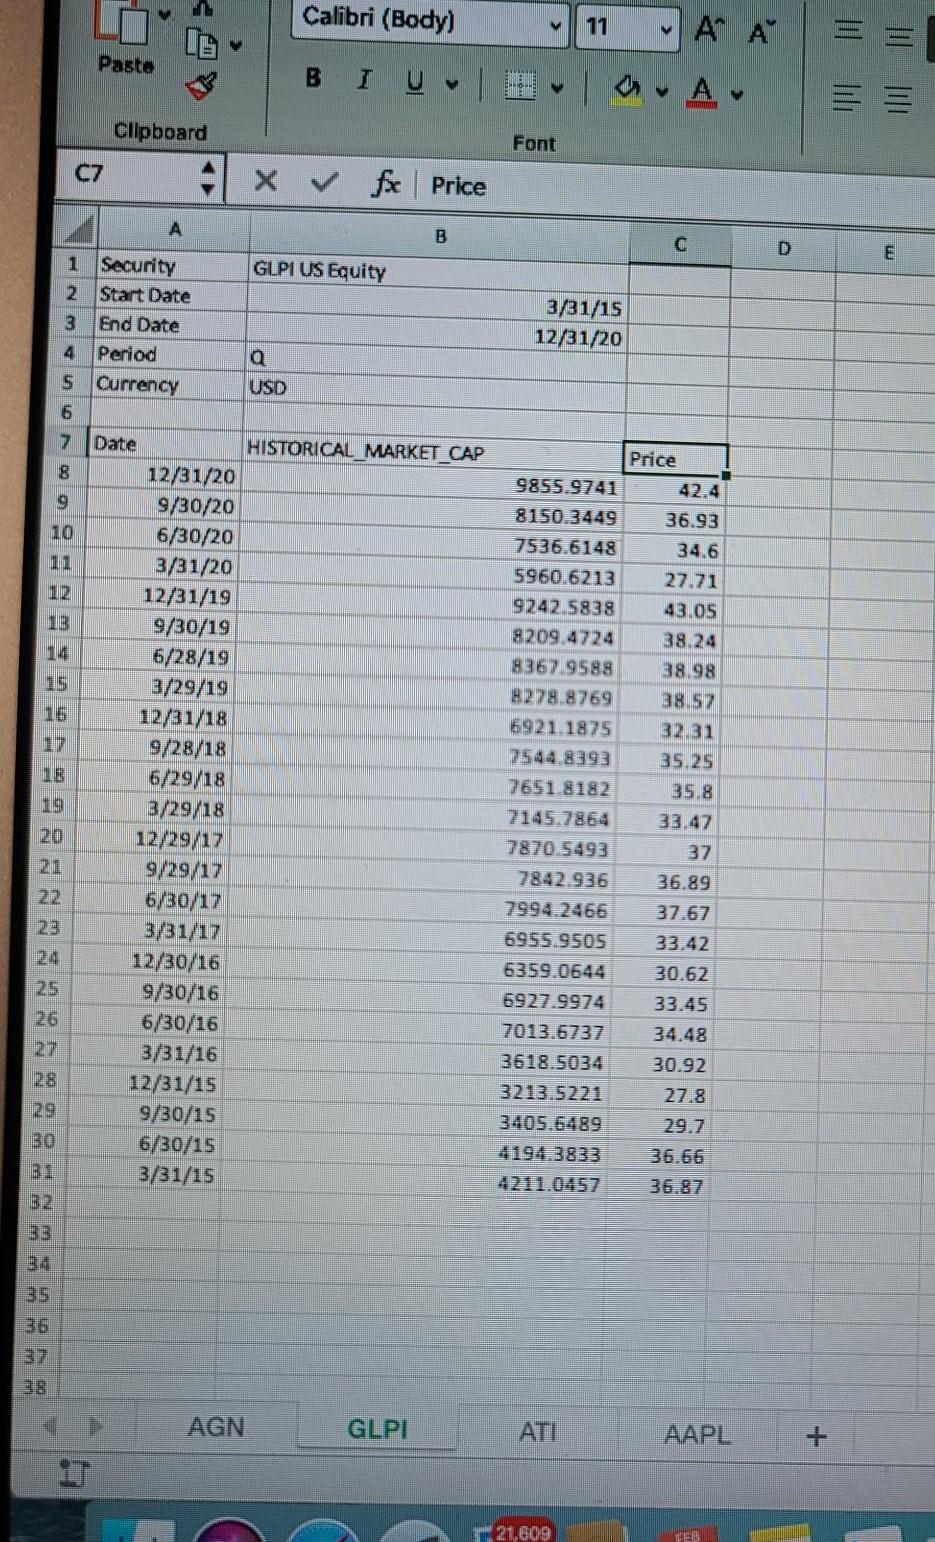
There are 3 Steps involved in it

Get step-by-step solutions from verified subject matter experts