

Question: Help The contour plot below gives the approximate density of the fox population ( in number of foxes per square kilometer ) in southern England.
Help
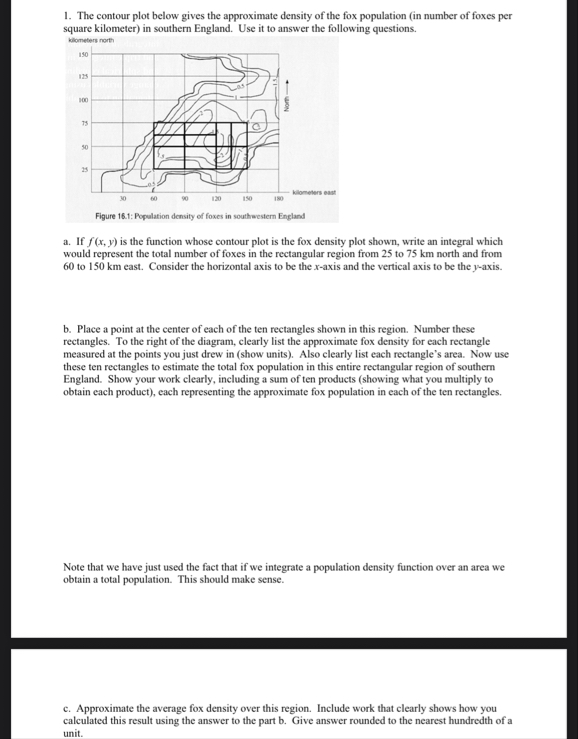
The contour plot below gives the approximate density of the fox population in number of foxes per square kilometer in southern England. Use it to answer the following questions.
a If is the function whose contour plot is the fox density plot shown, write an integral which would represent the total number of foxes in the rectangular region from to km north and from to km east. Consider the horizontal axis to be the axis and the vertical axis to be the axis.
b Place a point at the center of each of the ten rectangles shown in this region. Number these rectangles. To the right of the diagram, clearly list the approximate fox density for each rectangle measured at the points you just drew in show units Also clearly list each rectangle's area. Now use these ten rectangles to estimate the total fox population in this entire rectangular region of southern England. Show your work clearly, including a sum of ten products showing what you multiply to obtain each product each representing the approximate fox population in each of the ten rectangles.
Note that we have just used the fact that if we integrate a population density function over an area we obtain a total population. This should make sense.
c Approximate the average fox density over this region. Include work that clearly shows how you calculated this result using the answer to the part b Give answer rounded to the nearest hundredth of a unit.
Step by Step Solution
There are 3 Steps involved in it
1 Expert Approved Answer
Step: 1 Unlock

Question Has Been Solved by an Expert!
Get step-by-step solutions from verified subject matter experts
Step: 2 Unlock
Step: 3 Unlock