

Question: In Problem 5.31 you generated 5 different plots. Use subplots to plot the first 4 into a rectangular grid, much like we did in earlier
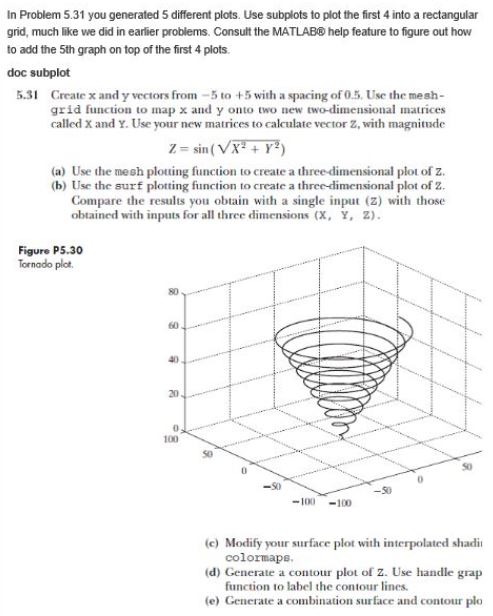
In Problem 5.31 you generated 5 different plots. Use subplots to plot the first 4 into a rectangular grid, much like we did in earlier problems. Consult the MATLAB help feature to figure out how to add the 5th graph on top of the first 4 plots doc subplot 5.31 Create x and y vectors from-5 to +5 with a spacing grid function to map x and y onto two new called X and Y. Use your new matrices to calculate vector Z, with magnitude of 0.5. Use the mesh- two-dimensional matrices 7-sin ( VXT +) (a) Use the mesh plouing function to create a three-dimensional plot of Z. (b) Use the surf plotting function to create a three-dimensional plot of 2 Compare the results you obtain with a single input (2) with those obtained with inputs for all three dimensions (X, Y, Z). Figure P5.30 Tornado plot 80 60 20 100 So -So 100-100 (c) Modify your surface plot with interpolated shadi colormaps (d) Generate a contour plot of Z. Use handle grap to label the contour lines (e) Generate a combination urface and contour plo In Problem 5.31 you generated 5 different plots. Use subplots to plot the first 4 into a rectangular grid, much like we did in earlier problems. Consult the MATLAB help feature to figure out how to add the 5th graph on top of the first 4 plots doc subplot 5.31 Create x and y vectors from-5 to +5 with a spacing grid function to map x and y onto two new called X and Y. Use your new matrices to calculate vector Z, with magnitude of 0.5. Use the mesh- two-dimensional matrices 7-sin ( VXT +) (a) Use the mesh plouing function to create a three-dimensional plot of Z. (b) Use the surf plotting function to create a three-dimensional plot of 2 Compare the results you obtain with a single input (2) with those obtained with inputs for all three dimensions (X, Y, Z). Figure P5.30 Tornado plot 80 60 20 100 So -So 100-100 (c) Modify your surface plot with interpolated shadi colormaps (d) Generate a contour plot of Z. Use handle grap to label the contour lines (e) Generate a combination urface and contour plo
Step by Step Solution
There are 3 Steps involved in it

Get step-by-step solutions from verified subject matter experts