

Question: Help The data in the table below are the result of a random survey of 39 national flags (with replacement between picks) from various countries.
Help
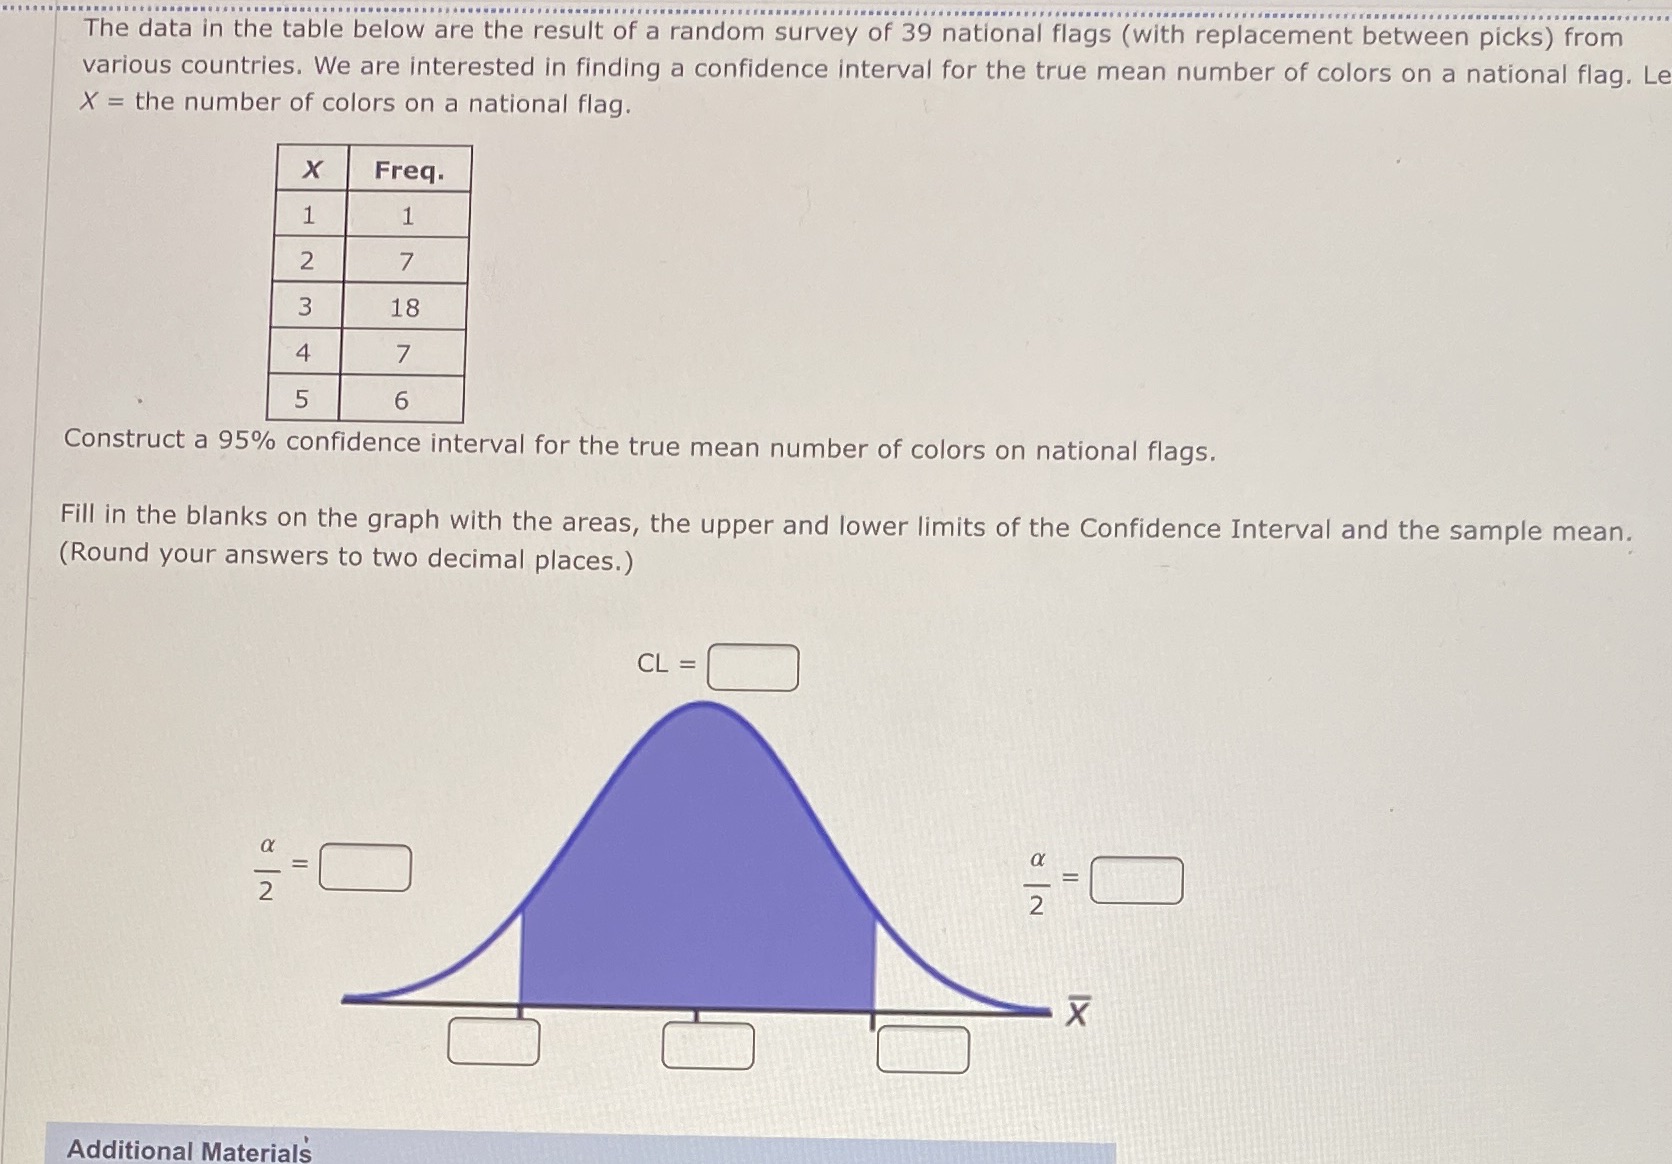
The data in the table below are the result of a random survey of 39 national flags (with replacement between picks) from various countries. We are interested in finding a confidence interval for the true mean number of colors on a national flag. Le X = the number of colors on a national flag. X Freq. 1 1 2 7 3 18 4 7 5 6 Construct a 95% confidence interval for the true mean number of colors on national flags. Fill in the blanks on the graph with the areas, the upper and lower limits of the Confidence Interval and the sample mean. (Round your answers to two decimal places.) CL = N| R = N| R = X Additional Materials
Step by Step Solution
There are 3 Steps involved in it
1 Expert Approved Answer
Step: 1 Unlock

Question Has Been Solved by an Expert!
Get step-by-step solutions from verified subject matter experts
Step: 2 Unlock
Step: 3 Unlock