Question: Help - The question is below - It states And now, it is your turn to ...... The question is on the page below RESEARCH
Help -
The question is below - It states "And now, it is your turn to ...... The question is on the page below
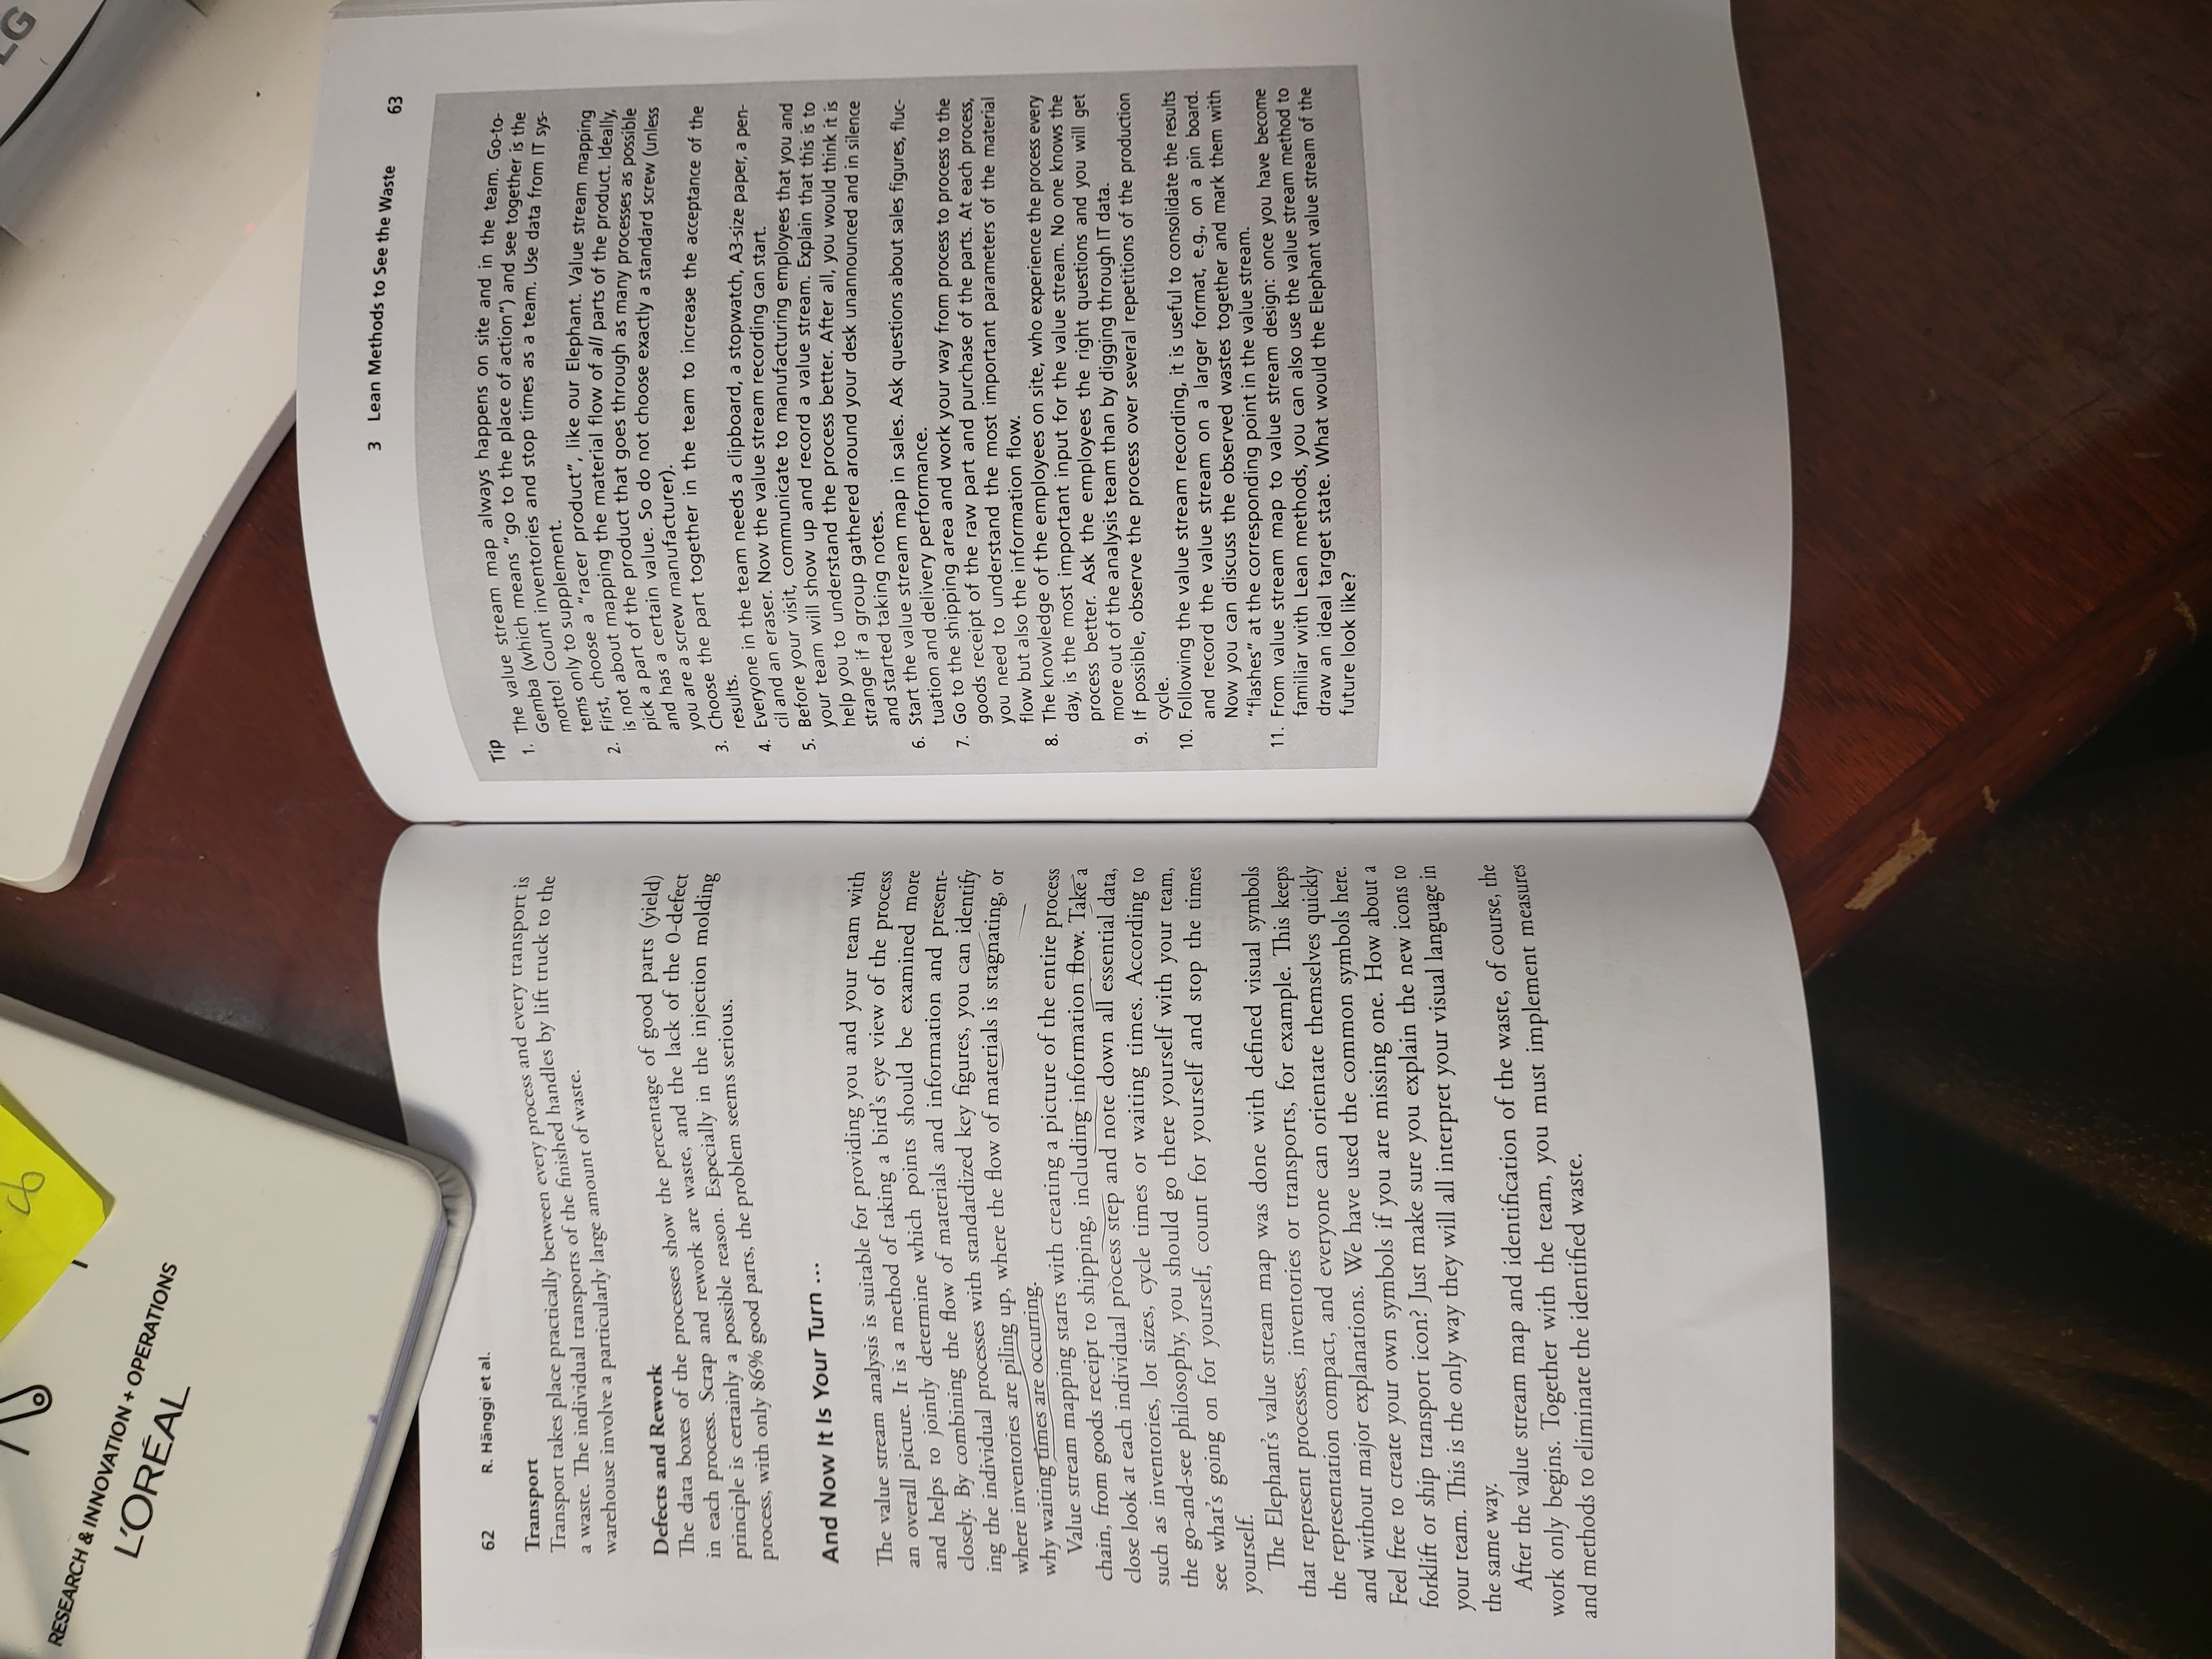
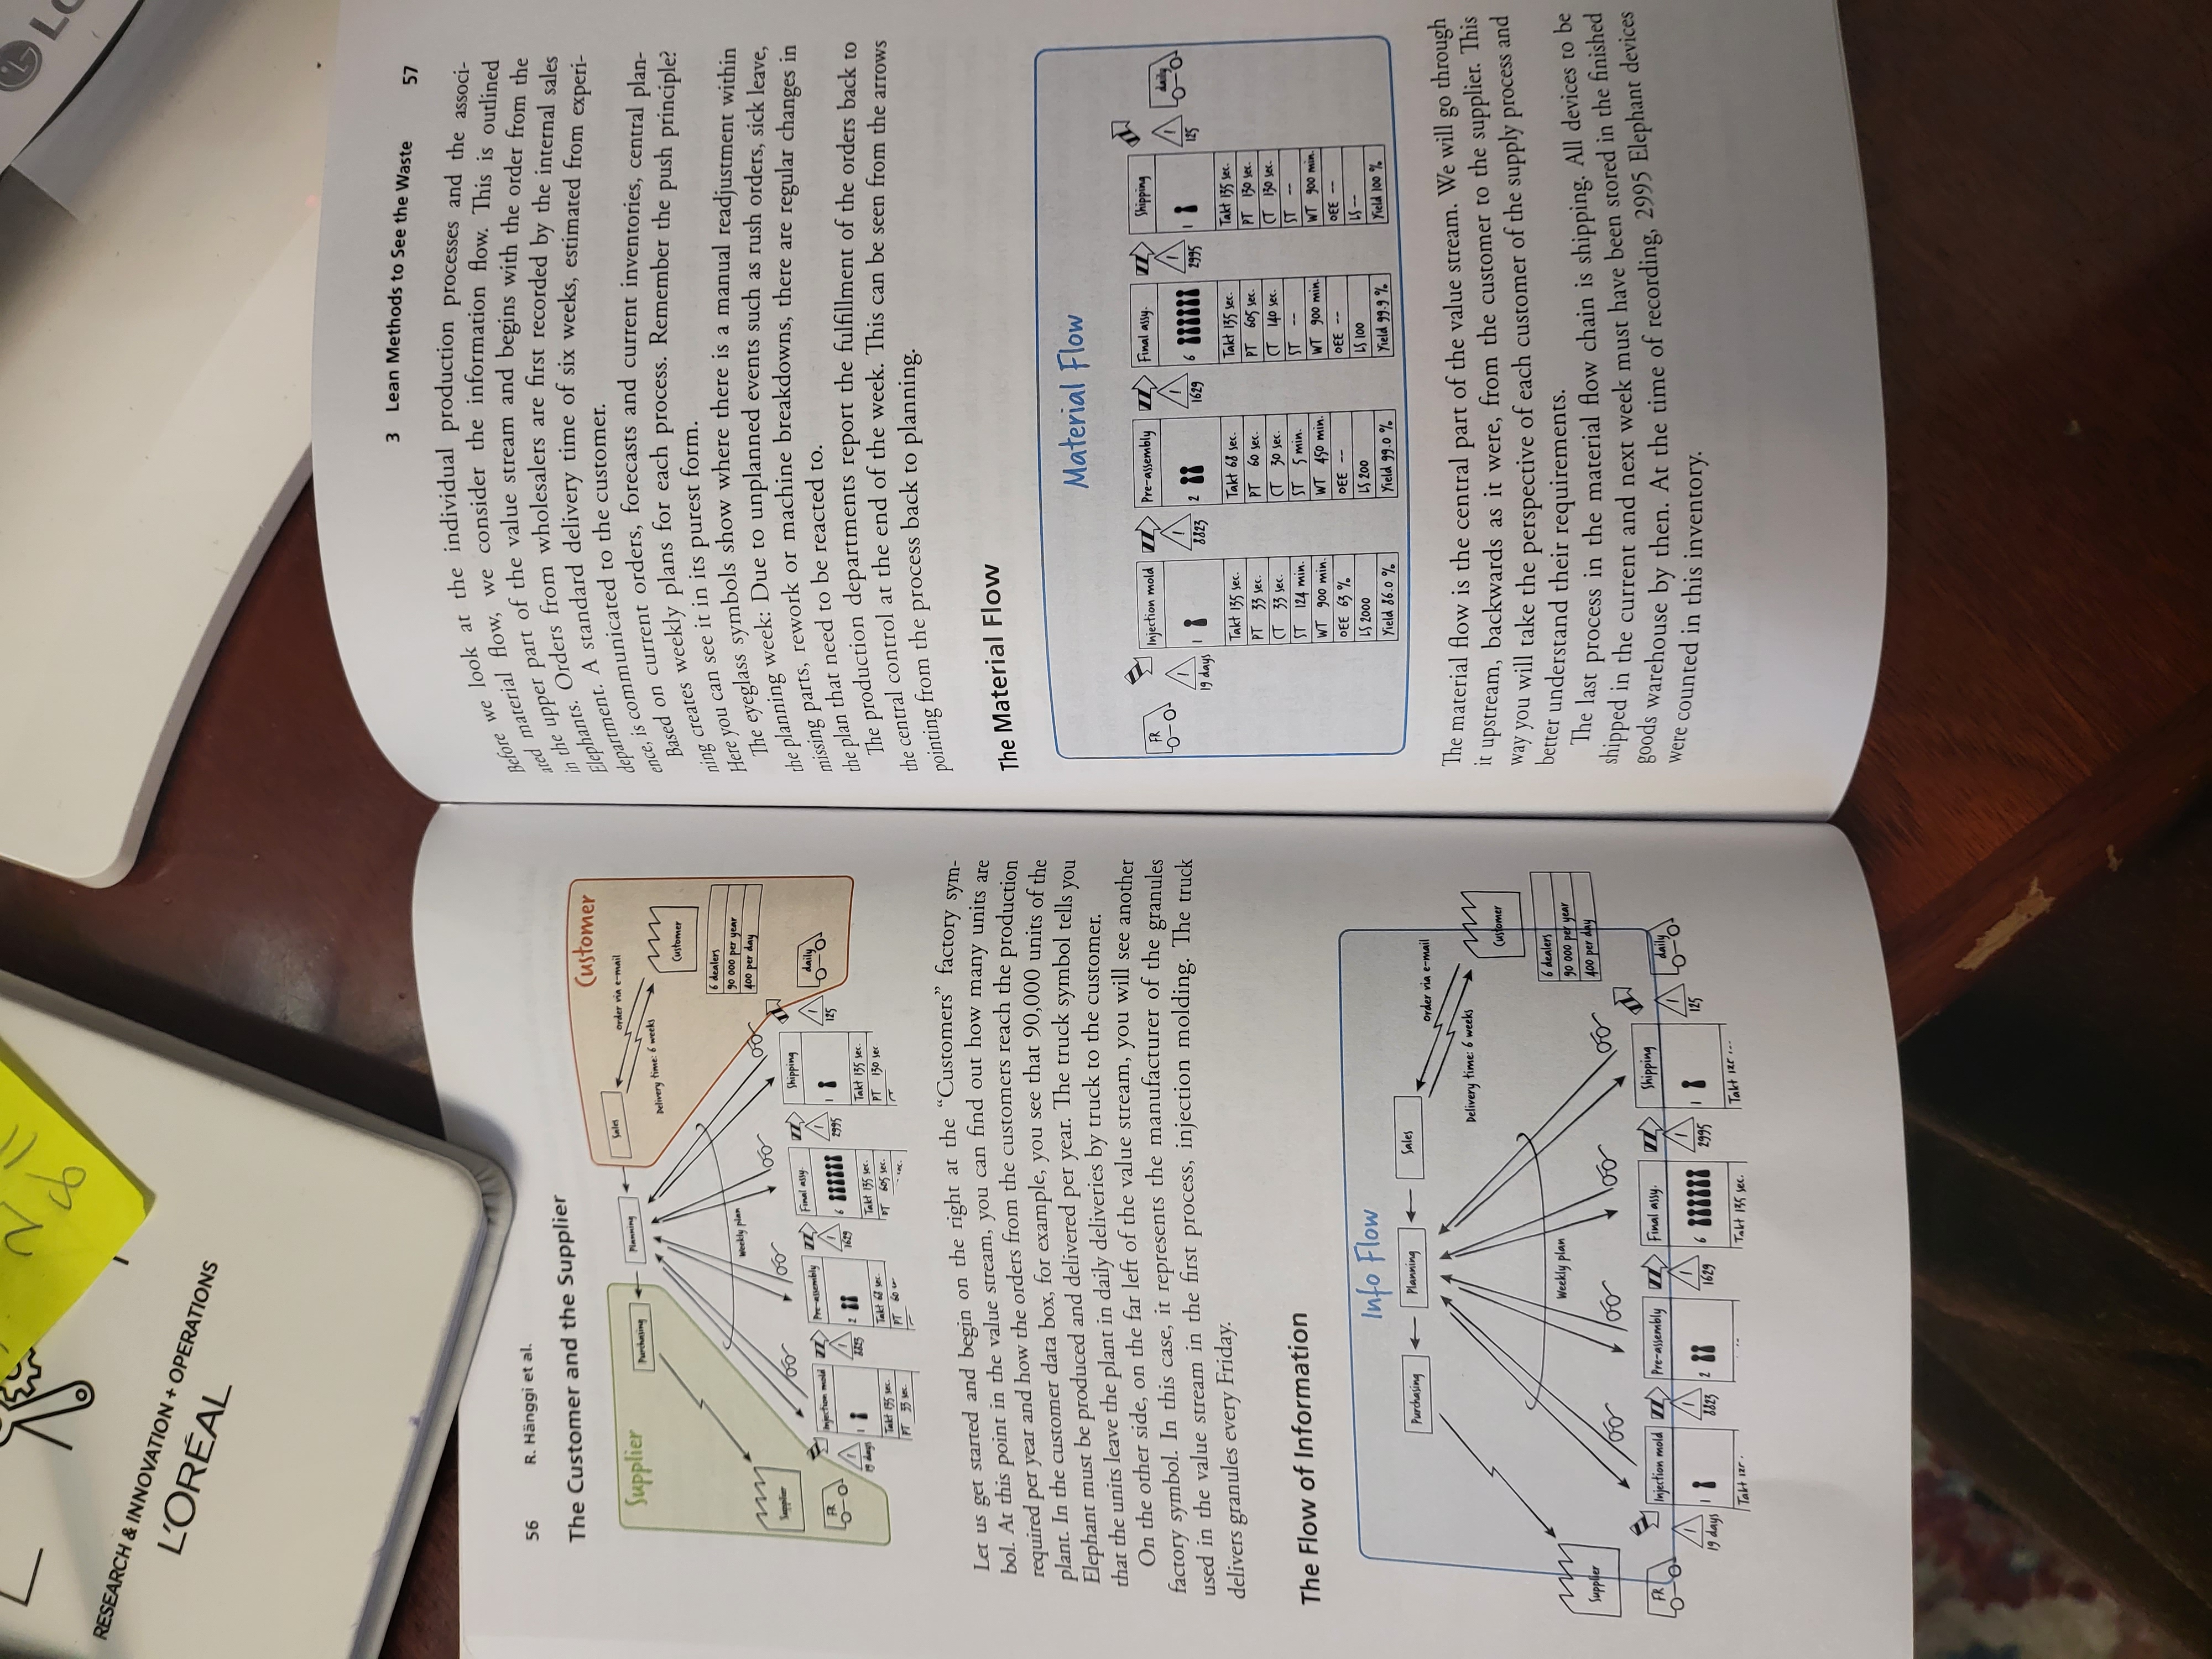
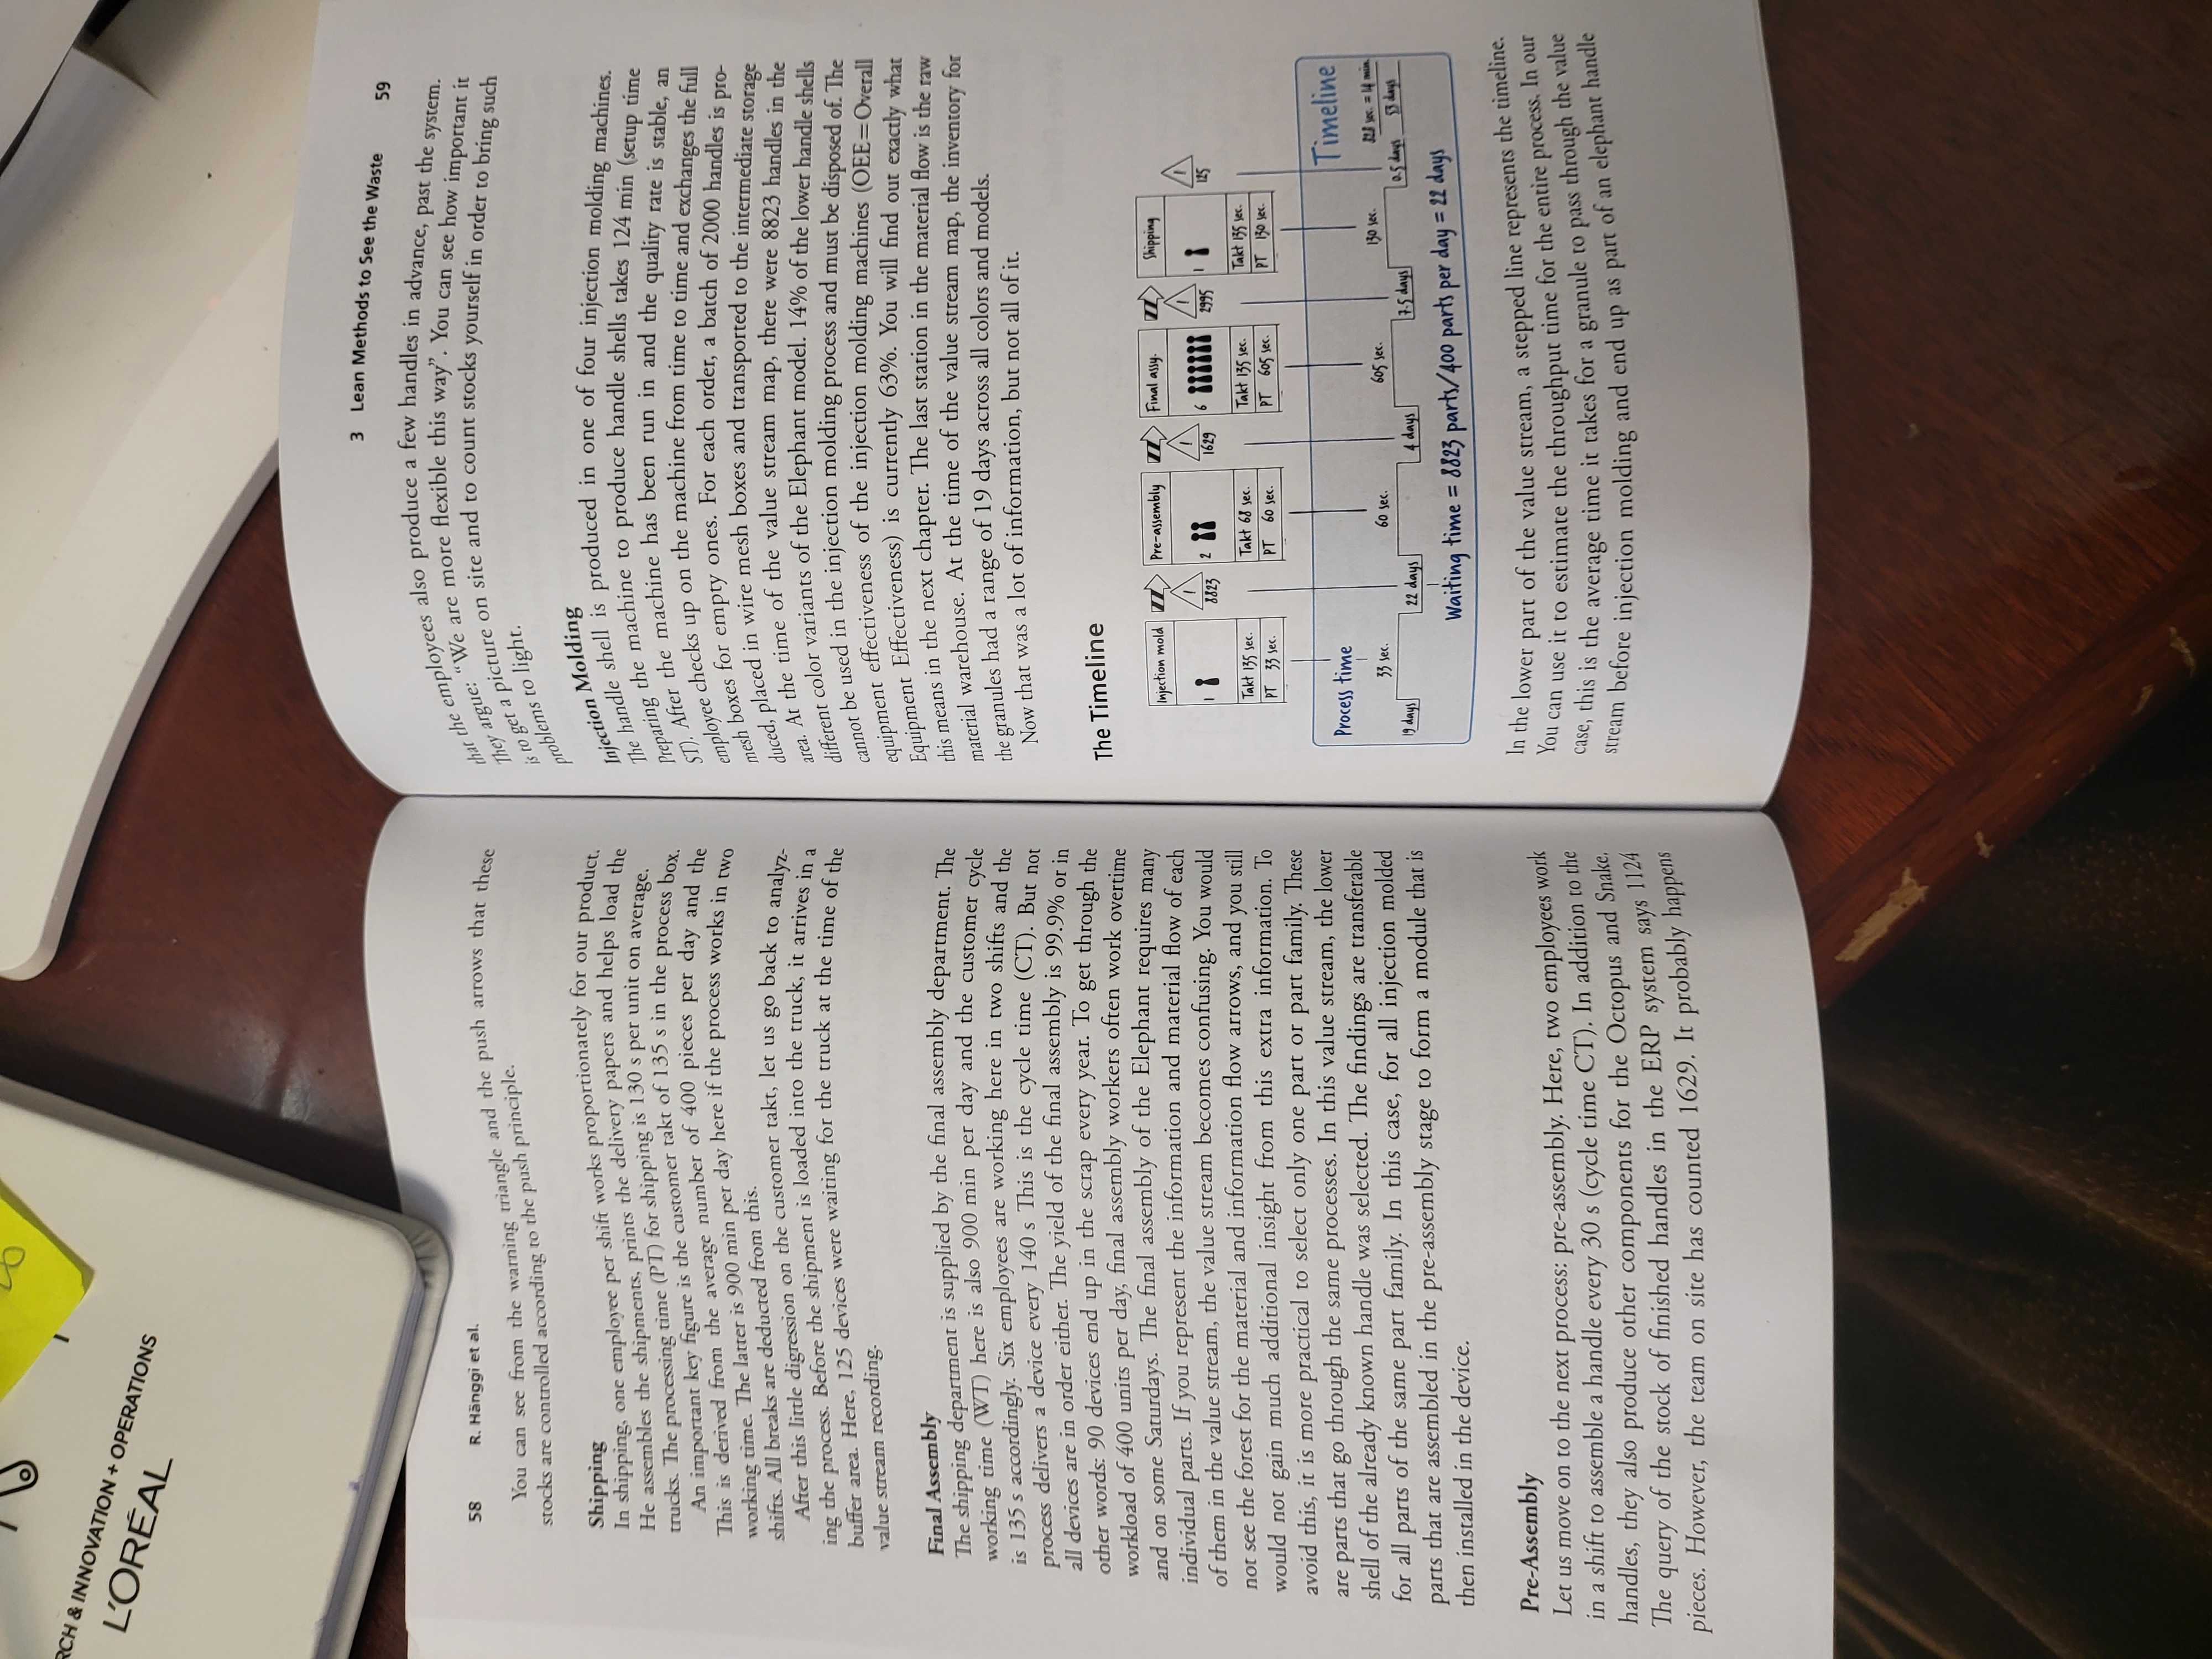
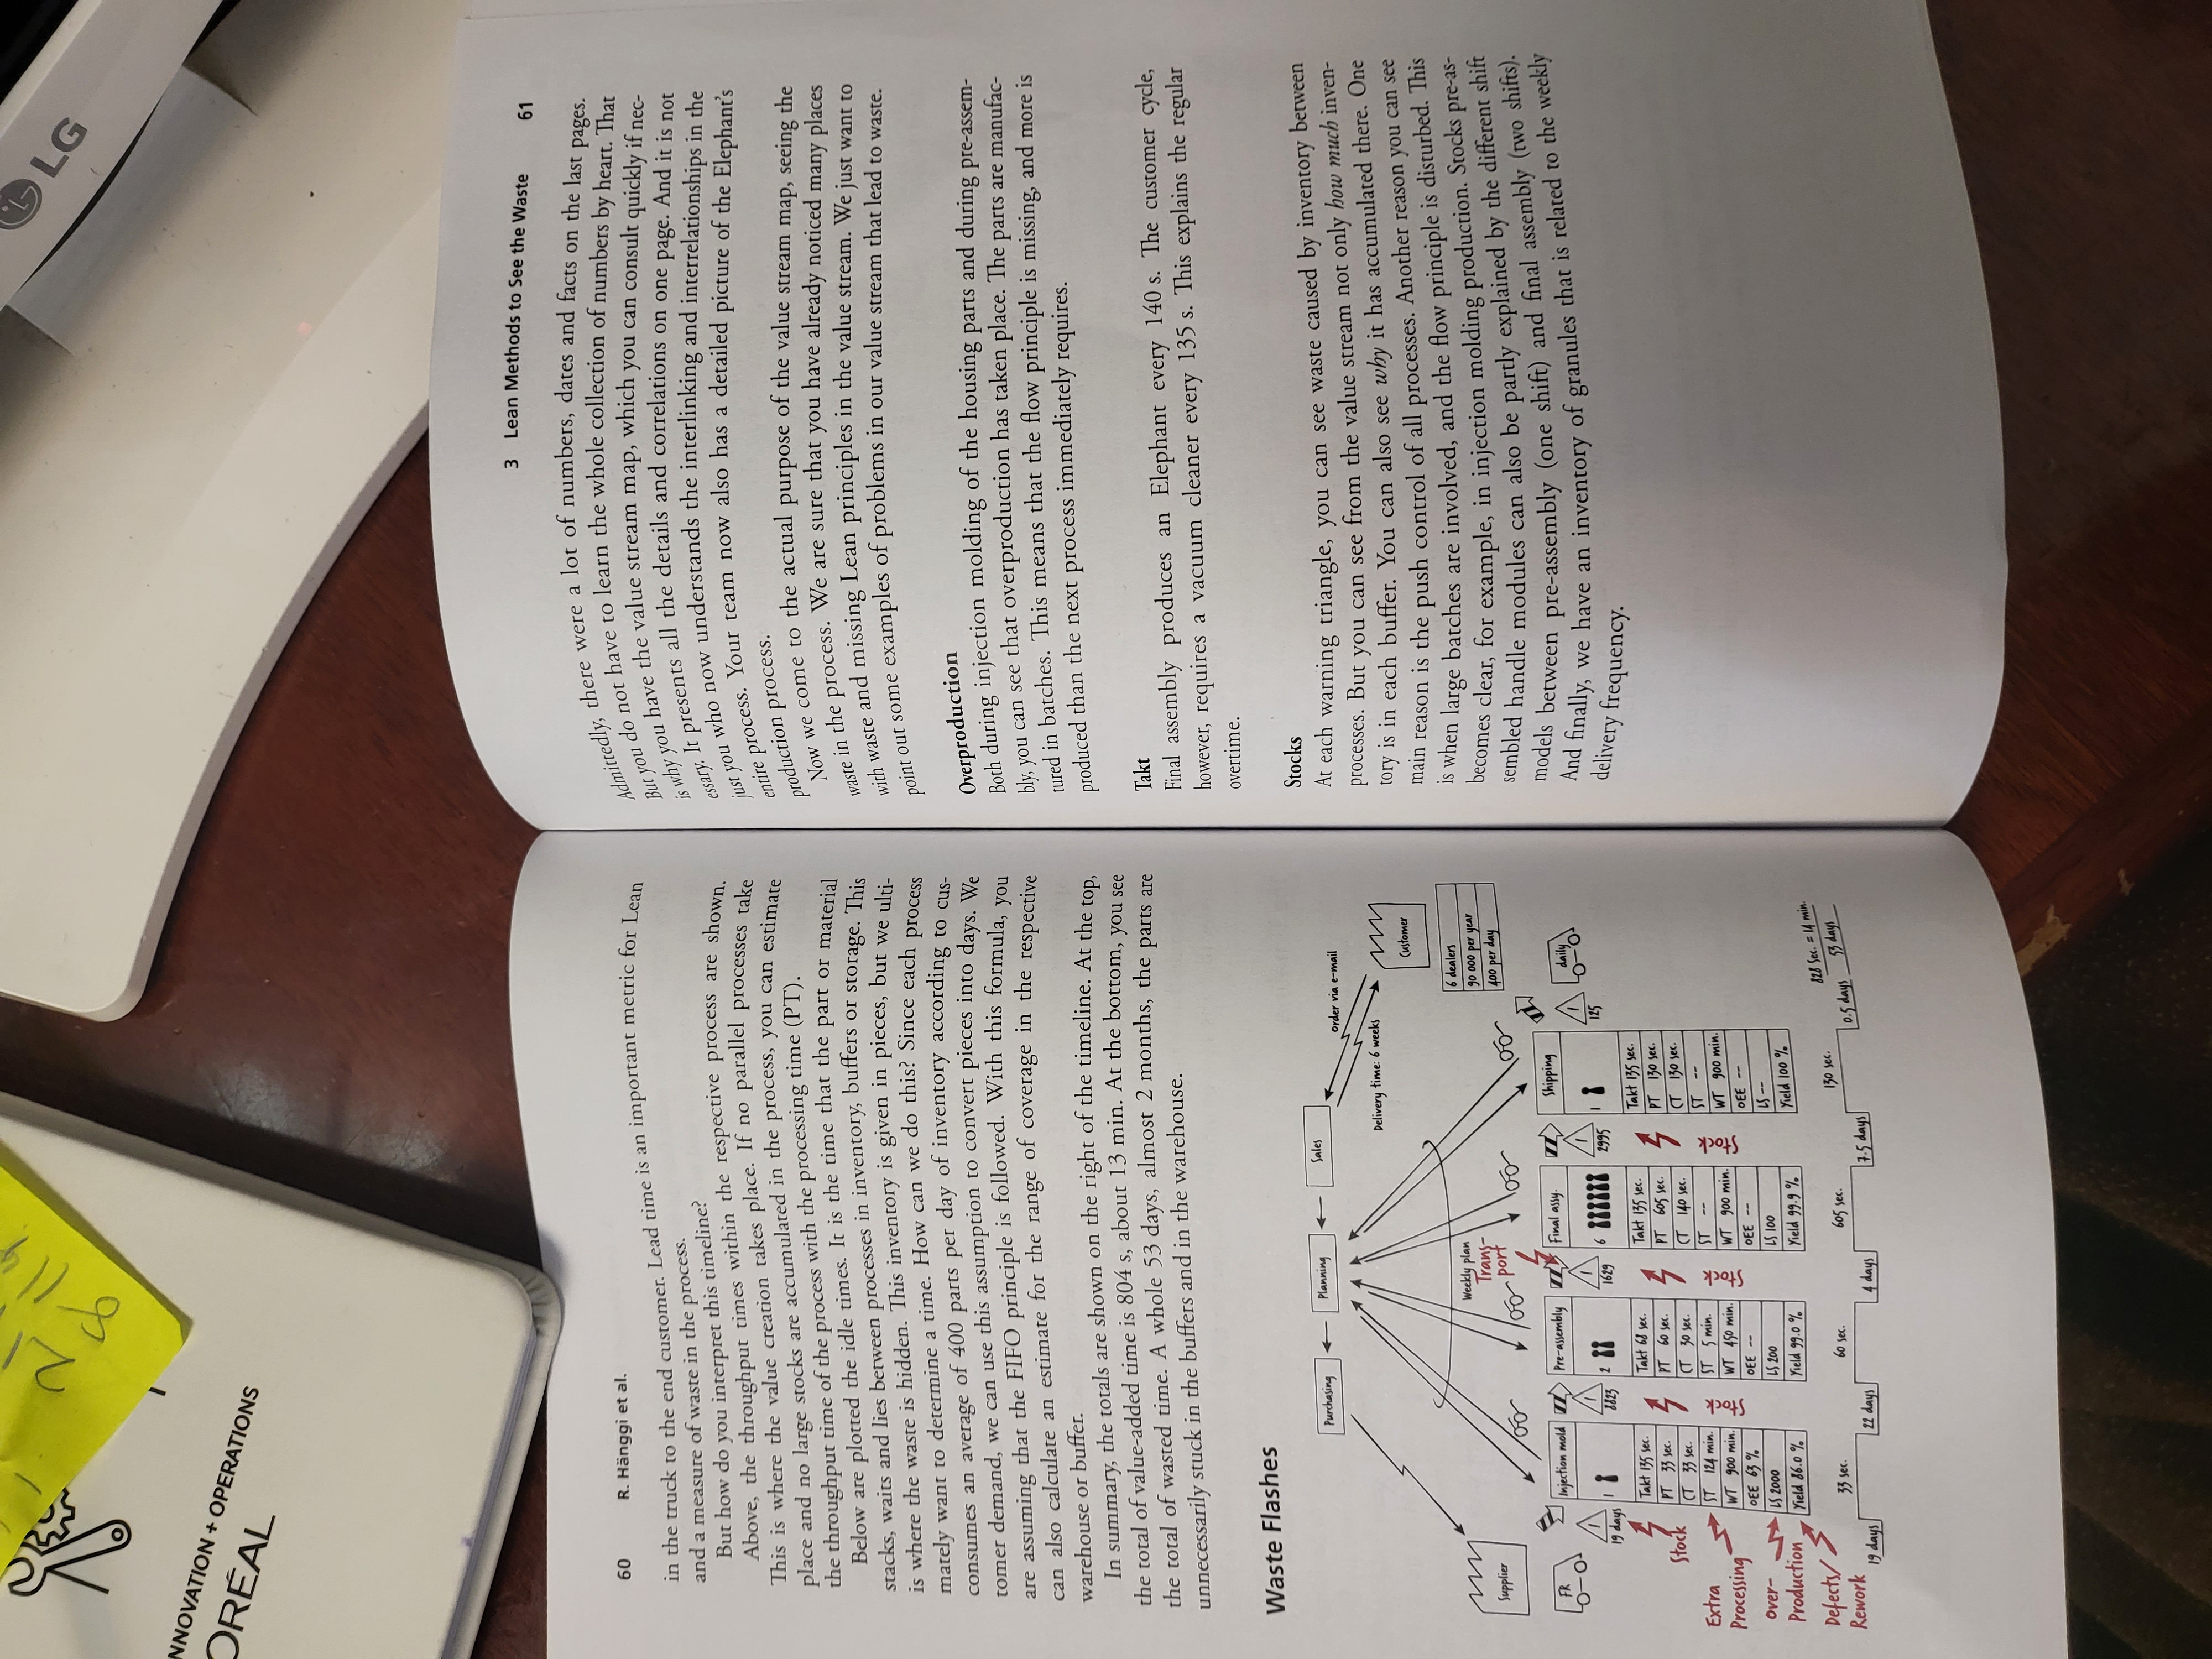
RESEARCH & INNOVATION + OPERATIONS L'OREAL 3 Lean Methods to See the Waste 63 62 R. Hanggi et al. Transport Tip Transport takes place practically between every process and every transport is 1. The value stream map always happens on site and in the team. Go-to- a waste. The individual transports of the finished handles by lift truck to the Gemba (which means "go to the place of action") and see together is the warehouse involve a particularly large amount of waste. motto! Count inventories and stop times as a team. Use data from IT sys- tems only to supplement . 2. First, choose a "racer product", like our Elephant. Value stream mapping Defects and Rework is not about mapping the material flow of all parts of the product. Ideally, The data boxes of the processes show the percentage of good parts (yield) pick a part of the product that goes through as many processes as possible in each process. Scrap and rework are waste, and the lack of the and has a certain value. So do not choose exactly a standard screw (unless principle is certainly a possible reason. Especially in the injection molding you are a screw manufacturer). process, with only 86% good parts, the problem seems serious. results . 3. Choose the part together in the team to increase the acceptance of the 4. Everyone in the team needs a clipboard, a stopwatch, A3-size paper, a pen- cil and an eraser. Now the value stream recording can start. And Now It Is Your Turn ... 5. Before your visit, communicate to manufacturing employees that you and your team will show up and record a value stream. Explain that this is to The value stream analysis is suitable for providing you and your team with help you to understand the process better. After all, you would think it is an overall picture. It is a method of taking a bird's eye view of the process strange if a group gathered around your desk unannounced and in silence and helps to jointly determine which points should be examined more and started taking notes. closely. By combining the flow of materials and information and present- 6. Start the value stream map in sales. Ask questions about sales figures, fluc- tuation and delivery performance. ing the individual processes with standardized key figures, you can identify 7. Go to the shipping area and work your way from process to process to the where inventories are piling up, where the flow of materials is stagnating, or goods receipt of the raw part and purchase of the parts. At each process, why waiting times are occurring. you need to understand the most important parameters of the material Value stream mapping starts with creating a picture of the entire process flow but also the information flow. chain, from goods receipt to shipping, including information flow. Take a 8. The knowledge of the employees on site, who experience the process every day, is the most important input for the value stream. No one knows the close look at each individual process step and note down all essential data, process better. Ask the employees the right questions and you will get such as inventories, lot sizes, cycle times or waiting times. According to more out of the analysis team than by digging through IT data. the go-and-see philosophy, you should go there yourself with your team, 9. If possible, observe the process over several repetitions of the production cycle. see what's going on for yourself, count for yourself and stop the times 10. Following the value stream recording, it is useful to consolidate the results yourself. and record the value stream on a larger format, e.g., on a pin board. The Elephant's value stream map was done with defined visual symbols Now you can discuss the observed wastes together and mark them with that represent processes, inventories or transports, for example. This keeps "flashes" at the corresponding point in the value stream. 11. From value stream map to value stream design: once you have become the representation compact, and everyone can orientate themselves quickly familiar with Lean methods, you can also use the value stream method to and without major explanations. We have used the common symbols here. draw an ideal target state. What would the Elephant value stream of the Feel free to create your own symbols if you are missing one. How about a future look like? forklift or ship transport icon? Just make sure you explain the new icons to your team. This is the only way they will all interpret your visual language in the same way. After the value stream map and identification of the waste, of course, the work only begins. Together with the team, you must implement measures and methods to eliminate the identified waste.RESEARCH & INNOVATION + OPERATIONS L'OREAL 3 Lean Methods to See the Waste 57 56 R. Hanggi et al. Before we look at the individual production processes and the associ- ved material flow, we consider the information flow. This is outlined The Customer and the Supplier in the upper part of the value stream and begins with the order from the Customer Elephants. Orders from wholesalers are first recorded by the internal sales Supplier Sales order via e-mail department. A standard delivery time of six weeks, estimated from experi- Delivery time: 6 weeks ence, is communicated to the customer. customer Based on current orders, forecasts and current inventories, central plan- ning creates weekly plans for each process. Remember the push principle: Weekly plan m 90 000 per year Here you can see it in its purest form . 400 per day The eyeglass symbols show where there is a manual readjustment within Injection mold IZ Pre-assembly IZ Final assy . IZ Shipping the planning week: Due to unplanned events such as rush orders, sick leave, missing parts, rework or machine breakdowns, there are regular changes in the plan that need to be reacted to. Takt of sec . Takt 135 sec . Takt 135 se Takt 15 sec. PT 130 let PT 35 sec. PT 60 Lm DT 605 sex . The production departments report the fulfillment of the orders back to the central control at the end of the week. This can be seen from the arrows Let us get started and begin on the right at the "Customers" factory sym- pointing from the process back to planning. bol. At this point in the value stream, you can find out how many units are required per year and how the orders from the customers reach the production The Material Flow plant. In the customer data box, for example, you see that 90,000 units of the Elephant must be produced and delivered per year. The truck symbol tells you that the units leave the plant in daily deliveries by truck to the customer. Material Flow On the other side, on the far left of the value stream, you will see another factory symbol. In this case, it represents the manufacturer of the granules Injection mold IZ Pre-assembly | Final assy . IZ Shipping used in the value stream in the first process, injection molding. The truck delivers granules every Friday. 9 days 18 8823 2 18 1629 6 188188 297518 Takt 135 sec . Takt 68 sec . Takt 135 sec Take 135 sec PT 33 sec. PT 60 sec . PT 605 se The Flow of Information T 130 sex. ( T 33 sec . CT 30 sec . T 140 sec . (T 130 sex . ST 124 min . ST 5 min . ST - WT 900 min WT 450 min. WT 900 min- WT 900 min. Info Flow OEE 63 OEE - OFF - DEE - LS 2000 LS 200 LS 100 LS - Purchasing Planning Sales Yield 86.0 % yield 99.0 % Yield 99.9 % Yield 100 % order via e -mail Delivery time: 6 weeks The material flow is the central part of the value stream. We will go through Customer t upstream, backwards as it were, from the customer to the supplier. This Weekly plan 6 dealers way you will take the perspective of each customer of the supply process and Supplier 90 000 per year better understand their requirements. 400 per day The last process in the material flow chain is shipping. All devices to be Injection mold IZ Pre-assembly IZ Final assy . IZ Shipping shipped in the current and next week must have been stored in the finished goods warehouse by then. At the time of recording, 2995 Elephant devices 19 days 1679 188181 2995 125 were counted in this inventory. Takt 125 . Taket 135 sec . Takt 125 ...RCH & INNOVATION + OPERATIONS L'OREAL 3 Lean Methods to See the Waste 59 58 R. Hanggi et al . that the employees also produce a few handles in advance, past the system. You can see from the warning triangle and the push arrows that these They argue: "We are more flexible this way". You can see how important it stocks are controlled according to the push principle. is to get a picture on site and to count stocks yourself in order to bring such problems to light. Shipping In shipping, one employee per shift works proportionately for our product. He assembles the shipments, prints the delivery papers and helps load the Injection Molding trucks. The processing time (PT) for shipping is 130 s per unit on average. The handle shell is produced in one of four injection molding machines. An important key figure is the customer takt of 135 s in the process box. Preparing the machine to produce handle shells takes 124 min (setup time This is derived from the average number of 400 pieces per day and the ST). After the machine has been run in and the quality rate is stable, an working time. The latter is 900 min per day here if the process works in two employee checks up on the machine from time to time and exchanges the full shifts. All breaks are deducted from this. mesh boxes for empty ones. For each order, a batch of 2000 handles is pro- After this little digression on the customer takt, let us go back to analyz- duced, placed in wire mesh boxes and transported to the intermediate storage ing the process. Before the shipment is loaded into the truck, it arrives in a area. At the time of the value stream map, there were 8823 handles in the buffer area. Here, 125 devices were waiting for the truck at the time of the different color variants of the Elephant model. 14% of the lower handle shells value stream recording. cannot be used in the injection molding process and must be disposed of. The equipment effectiveness of the injection molding machines (OEE=Overall Final Assembly Equipment Effectiveness) is currently 63%. You will find out exactly what The shipping department is supplied by the final assembly department. The working time (WT) here is also 900 min per day and the customer cycle this means in the next chapter. The last station in the material flow is the raw is 135 s accordingly. Six employees are working here in two shifts and the material warehouse. At the time of the value stream map, the inventory for process delivers a device every 140 s This is the cycle time (CT). But not the granules had a range of 19 days across all colors and models. Now that was a lot of information, but not all of it. all devices are in order either. The yield of the final assembly is 99.9% or in other words: 90 devices end up in the scrap every year. To get through the workload of 400 units per day, final assembly workers often work overtime The Timeline and on some Saturdays. The final assembly of the Elephant requires many individual parts. If you represent the information and material flow of each Injection mold Pre-assembly |IZ Final assy. IZ Shipping of them in the value stream, the value stream becomes confusing. You would not see the forest for the material and information flow arrows, and you still 3823 1679 16 818181 2995 would not gain much additional insight from this extra information. To Takt 135 sec . Takt 68 sec . Takt 135 sec . Takt 135 sec . avoid this, it is more practical to select only one part or part family. These PT 33 sec. PT 60 sec . PT 605 sec. PT 130 sex. are parts that go through the same processes. In this value stream, the lower shell of the already known handle was selected. The findings are transferable Process time Timeline for all parts of the same part family. In this case, for all injection molded 33 sec 60 sec. 605 sec 130 sex. parts that are assembled in the pre-assembly stage to form a module that is 19 days 22 days 4 days 7.5 days asdays 3 days then installed in the device. Waiting time = 8823 parts/400 parts per day = 22 days Pre-Assembly Let us move on to the next process: pre-assembly. Here, two employees work In the lower part of the value stream, a stepped line represents the timeline. in a shift to assemble a handle every 30 s (cycle time CT). In addition to the You can use it to estimate the throughput time for the entire process. In our handles, they also produce other components for the Octopus and Snake, case, this is the average time it takes for a granule to pass through the value The query of the stock of finished handles in the ERP system says 1124 stream before injection molding and end up as part of an elephant handle pieces. However, the team on site has counted 1629. It probably happensLG NNOVATION + OPERATIONS OREAL 3 Lean Methods to See the Waste 61 60 R. Hanggi et al. in the truck to the end customer. Lead time is an important metric for Lean Admittedly, there were a lot of numbers, dates and facts on the last pages. But you do not have to learn the whole collection of numbers by heart. That and a measure of waste in the process. 's why you have the value stream map, which you can consult quickly if neca But how do you interpret this timeline? Above, the throughput times within the respective process are shown. essary. It presents all the details and correlations on one page. And it is not This is where the value creation takes place. If no parallel processes take just you who now understands the interlinking and interrelationships in the place and no large stocks are accumulated in the process, you can estimate entire process. Your team now also has a detailed picture of the Elephant's he throughput time of the process with the processing time (PT). production process . Below are plotted the idle times. It is the time that the part or material Now we come to the actual purpose of the value stream map, seeing the stacks, waits and lies between processes in inventory, buffers or storage. This waste in the process. We are sure that you have already noticed many places is where the waste is hidden. This inventory is given in pieces, but we ulti- with waste and missing Lean principles in the value stream. We just want to mately want to determine a time. How can we do this? Since each process point out some examples of problems in our value stream that lead to waste. consumes an average of 400 parts per day of inventory according to cus- tomer demand, we can use this assumption to convert pieces into days. We Overproduction are assuming that the FIFO principle is followed. With this formula, you Both during injection molding of the housing parts and during pre-assem- can also calculate an estimate for the range of coverage in the respective bly, you can see that overproduction has taken place. The parts are manufac warehouse or buffer. tured in batches. This means that the flow principle is missing, and more is In summary, the totals are shown on the right of the timeline. At the top, produced than the next process immediately requires. the total of value-added time is 804 s, about 13 min. At the bottom, you see the total of wasted time. A whole 53 days, almost 2 months, the parts are Takt unnecessarily stuck in the buffers and in the warehouse. Final assembly produces an Elephant every 140 s. The customer cycle, however, requires a vacuum cleaner every 135 s. This explains the regular Waste Flashes overtime . Purchasing 4 Planning Sales Stock order via e-mail At each warning triangle, you can see waste caused by inventory between Delivery time : 6 weeks m processes. But you can see from the value stream not only how much inven- Customer tory is in each buffer. You can also see why it has accumulated there. One M eekly plan 6 dealers main reason is the push control of all processes. Another reason you can see Supplier Trans go 000 per year is when large batches are involved, and the flow principle is disturbed. This of port 400 per day becomes clear, for example, in injection molding production. Stocks pre-as- 2 Injection mold IZ Pre-assembly I Final assy . IZ Shipping sembled handle modules can also be partly explained by the different shift O-O models between pre-assembly (one shift) and final assembly (two shifts). 19 days 1 8 8473 2 1699 2995 175 And finally, we have an inventory of granules that is related to the weekly 4 Takt 135 sec. Takt 60 sec. Takt 135 sec . Takt 135 sec delivery frequency. Stock PT 33 sec. PT 60 sec . PT 605 sec. PT 130 sec. CT 33 sec . 7 CT 30 sec. 7 (T 140 sec . CT 130 sec. Extra ST 124 min ST 5 min. ST - ST -- Processing WT 900 min . tock W1 450 min. DEE 63 % WT 900 min. WT 900 min. OEE -- OFE -- DEE - - over - LS 2000 LS 200 LS 100 LS - - Production Yield 86.0% Yield 99.0 % yield 99.9 % Yield 100 Defects / Rework 33 sec . 60 sec . 605 sec 130 sec . 828 Sec. = 14 min 19 days 22 days 4 days 7.5 days 10.5 days 53 days
Step by Step Solution
There are 3 Steps involved in it
1 Expert Approved Answer
Step: 1 Unlock
Question Has Been Solved by an Expert!
Get step-by-step solutions from verified subject matter experts
Step: 2 Unlock
Step: 3 Unlock
Students Have Also Explored These Related General Management Questions!