

Question: Help to understand this data I ran a regressions test, but I don't understand what this chart is telling me. I am trying to find
Help to understand this data
I ran a regressions test, but I don't understand what this chart is telling me.
I am trying to find out whetherIs there a linear relationship between feelings toward conservatives and beliefs regarding gay persons' right to marry one another. See below:
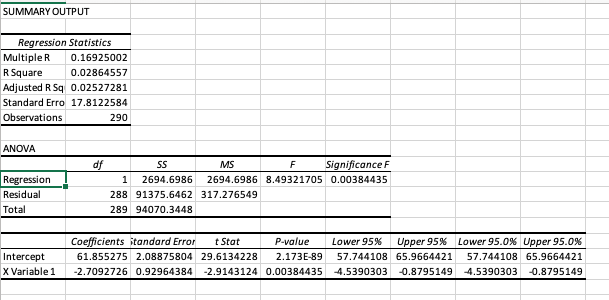
SUMMARY OUTPUT Regression Statistics Multiple R 0.16925002 R Square 0.02864557 Adjusted R Sq 0.02527281 Standard Erro 17.8122584 Observations 290 ANOVA of SS MS F Significance F Regression 1 2694.6986 2694.6986 8.49321705 0.00384435 Residual 288 91375.6462 317.276549 Total 289 94070.3448 Coefficients itandard Error t Stat P-value Lower 95% Upper 95% Lower 95.0% Upper 95.0% Intercept 61.855275 2.08875804 29.6134228 2.173E-89 57.744108 65.9664421 57.744108 65.9664421 X Variable 1 -2.7092726 0.92964384 -2.9143124 0.00384435 -4.5390303 -0.8795149 -4.5390303 -0.8795149
Step by Step Solution
There are 3 Steps involved in it

Get step-by-step solutions from verified subject matter experts