

Question: help Table 2: 2015-2016 POS Trending Jan-14 Feb-14 Mar-14 Apr-14 May-14 Jun-14 Jul-14 Aug-14 Sep-14 Oct-14 Nov-14 Dec-14 Jan-15 Feb-15 Mar-15 Apr-15 May-15 Jun-15 Jul-15
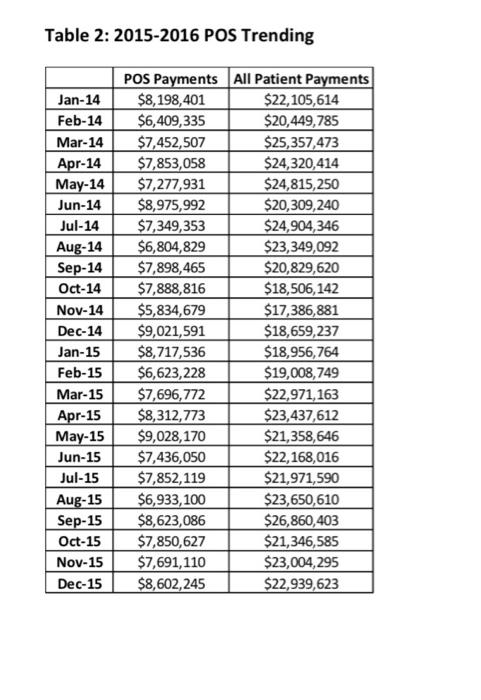
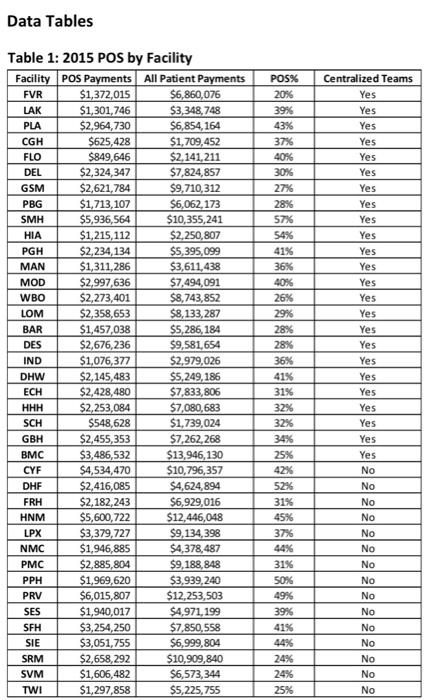
Table 2: 2015-2016 POS Trending Jan-14 Feb-14 Mar-14 Apr-14 May-14 Jun-14 Jul-14 Aug-14 Sep-14 Oct-14 Nov-14 Dec-14 Jan-15 Feb-15 Mar-15 Apr-15 May-15 Jun-15 Jul-15 Aug-15 Sep-15 Oct-15 Nov-15 Dec-15 POS Payments All Patient Payments $8,198,401 $22,105,614 $6,409,335 $20,449,785 $7,452,507 $25,357,473 $7,853,058 $24,320,414 $7,277,931 $24,815,250 $8,975,992 $20,309,240 $7,349,353 $24,904,346 $6,804,829 $23,349,092 $7,898,465 $20,829,620 $7,888,816 $18,506,142 $5,834,679 $17,386,881 $9,021,591 $18,659,237 $8,717,536 $18,956,764 $6,623,228 $19,008,749 $7,696,772 $22,971,163 $8,312,773 $23,437,612 $9,028,170 $21,358,646 $7,436,050 $22,168,016 $7,852, 119 $21,971,590 $6,933,100 $23,650,610 $8,623,086 $26,860,403 $7,850,627 $21,346,585 $7,691,110 $23,004,295 $8,602,245 $22,939,623 Data Tables POS% 20% 39% 43% Table 1: 2015 POS by Facility Facility POS Payments All Patient Payments FVR $1,372,015 $6,860,076 LAK $1,301,746 $3,348,748 PLA $2,964,730 $6,854,164 CGH $625,428 $1,709,452 FLO $849,646 $2,141,211 DEL $2,324,347 $7,824,857 GSM $2,621,784 $9,710,312 PBG $1,713,107 $6,062,173 SMH $5,936,564 $10,355,241 HIA $1,215,112 $2,250,807 PGH $2,234,134 $5,395,099 MAN $1,311,286 $3,611,438 MOD $2,997,636 $7,494,091 WBO $2,273,401 $8,743,852 LOM $2,358,653 $8,133,287 BAR $1,457,038 $5,286, 184 DES $2,676,236 $9,581,654 IND $1,076,377 $2.979,026 DHW $2,145,483 $5,249,186 ECH $2,428,480 $7,833,806 HHH $2,253,084 $7,080,683 SCH $548,628 $1,739,024 GBH $2,455,353 $7,262,268 BMC $3,486,532 $13,946,130 CYF $4,534,470 $10,796,357 DHF $2,416,085 $4,624,894 FRH $2,182,243 $6,929,016 HNM $5,600,722 $12,446,048 LPX $3,379,727 $9,134,398 NMC $1,946,885 $4,378,487 PMC $2,885,804 $9,188,848 PPH $1,969,620 $3,939, 240 PRV $6,015,807 $12,253,503 $1,940,017 $4,971,199 SFH $3,254,250 $7,850,558 SIE $3,051,755 $6,999,804 SRM $2,658,292 $10,909,840 SVM $1,606,482 $6,573,344 TWI $1,297,858 $5,225,755 37% 40% 30% 27% 28% 57% 54% 41% 36% 40% 26% 29% 28% 28% 36% 41% 31% 32% 32% 34% 25% 42% 52% 31% 45% 37% Centralized Teams Yes Yes Yes Yes Yes Yes Yes Yes Yes Yes Yes Yes Yes Yes Yes Yes Yes Yes Yes Yes Yes Yes Yes Yes No No No No No No No No No No No No SES 31% SOX 49% 39% 41% 44% 24% 24% 25% No No No Exercise 4 Solution Categories Based on the information provided what could be affinity categories for the key drivers that impact POS performance? Table 2: 2015-2016 POS Trending Jan-14 Feb-14 Mar-14 Apr-14 May-14 Jun-14 Jul-14 Aug-14 Sep-14 Oct-14 Nov-14 Dec-14 Jan-15 Feb-15 Mar-15 Apr-15 May-15 Jun-15 Jul-15 Aug-15 Sep-15 Oct-15 Nov-15 Dec-15 POS Payments All Patient Payments $8,198,401 $22,105,614 $6,409,335 $20,449,785 $7,452,507 $25,357,473 $7,853,058 $24,320,414 $7,277,931 $24,815,250 $8,975,992 $20,309,240 $7,349,353 $24,904,346 $6,804,829 $23,349,092 $7,898,465 $20,829,620 $7,888,816 $18,506,142 $5,834,679 $17,386,881 $9,021,591 $18,659,237 $8,717,536 $18,956,764 $6,623,228 $19,008,749 $7,696,772 $22,971,163 $8,312,773 $23,437,612 $9,028,170 $21,358,646 $7,436,050 $22,168,016 $7,852, 119 $21,971,590 $6,933,100 $23,650,610 $8,623,086 $26,860,403 $7,850,627 $21,346,585 $7,691,110 $23,004,295 $8,602,245 $22,939,623 Data Tables POS% 20% 39% 43% Table 1: 2015 POS by Facility Facility POS Payments All Patient Payments FVR $1,372,015 $6,860,076 LAK $1,301,746 $3,348,748 PLA $2,964,730 $6,854,164 CGH $625,428 $1,709,452 FLO $849,646 $2,141,211 DEL $2,324,347 $7,824,857 GSM $2,621,784 $9,710,312 PBG $1,713,107 $6,062,173 SMH $5,936,564 $10,355,241 HIA $1,215,112 $2,250,807 PGH $2,234,134 $5,395,099 MAN $1,311,286 $3,611,438 MOD $2,997,636 $7,494,091 WBO $2,273,401 $8,743,852 LOM $2,358,653 $8,133,287 BAR $1,457,038 $5,286, 184 DES $2,676,236 $9,581,654 IND $1,076,377 $2.979,026 DHW $2,145,483 $5,249,186 ECH $2,428,480 $7,833,806 HHH $2,253,084 $7,080,683 SCH $548,628 $1,739,024 GBH $2,455,353 $7,262,268 BMC $3,486,532 $13,946,130 CYF $4,534,470 $10,796,357 DHF $2,416,085 $4,624,894 FRH $2,182,243 $6,929,016 HNM $5,600,722 $12,446,048 LPX $3,379,727 $9,134,398 NMC $1,946,885 $4,378,487 PMC $2,885,804 $9,188,848 PPH $1,969,620 $3,939, 240 PRV $6,015,807 $12,253,503 $1,940,017 $4,971,199 SFH $3,254,250 $7,850,558 SIE $3,051,755 $6,999,804 SRM $2,658,292 $10,909,840 SVM $1,606,482 $6,573,344 TWI $1,297,858 $5,225,755 37% 40% 30% 27% 28% 57% 54% 41% 36% 40% 26% 29% 28% 28% 36% 41% 31% 32% 32% 34% 25% 42% 52% 31% 45% 37% Centralized Teams Yes Yes Yes Yes Yes Yes Yes Yes Yes Yes Yes Yes Yes Yes Yes Yes Yes Yes Yes Yes Yes Yes Yes Yes No No No No No No No No No No No No SES 31% SOX 49% 39% 41% 44% 24% 24% 25% No No No Exercise 4 Solution Categories Based on the information provided what could be affinity categories for the key drivers that impact POS performance
Step by Step Solution
There are 3 Steps involved in it

Get step-by-step solutions from verified subject matter experts