

Question: help using matlab 9. Plot the following sine signal, where the plot is blue when the value is larger than zero and the plot is
help using matlab
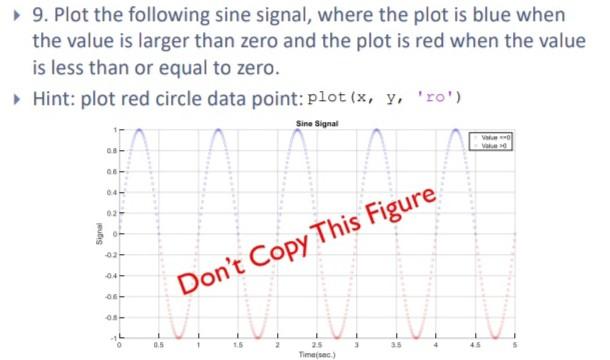
9. Plot the following sine signal, where the plot is blue when the value is larger than zero and the plot is red when the value is less than or equal to zero. Hint: plot red circle data point: plot (x, y, 'ro') Sine Signal WW 03- Signal -04- Don't Copy This Figure - 0.5 3 Times)
Step by Step Solution
There are 3 Steps involved in it
1 Expert Approved Answer
Step: 1 Unlock

Question Has Been Solved by an Expert!
Get step-by-step solutions from verified subject matter experts
Step: 2 Unlock
Step: 3 Unlock