

Question: Using matlab to solve the following Case function Range of y [-4.5, 2.8] dy dt 1. Using Matlab, find the equilibrium values of the given
Using matlab to solve the following
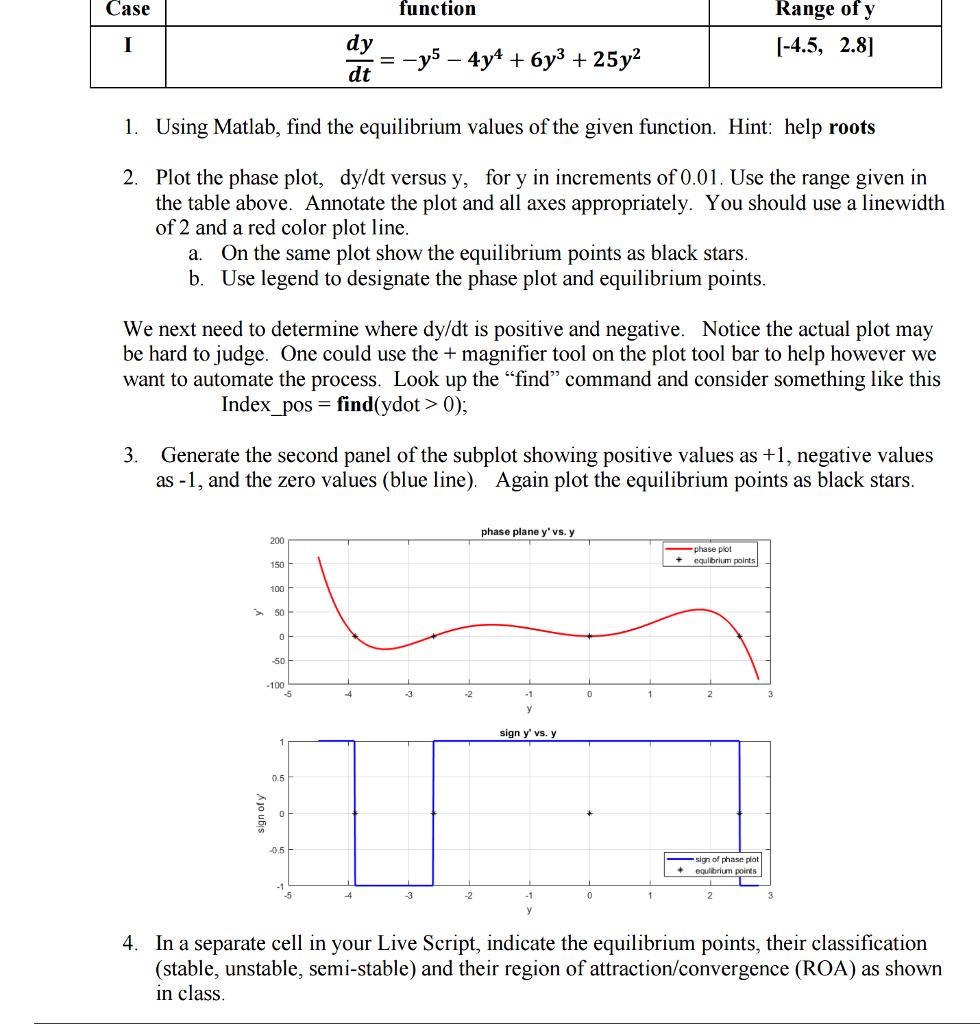
Case function Range of y [-4.5, 2.8] dy dt 1. Using Matlab, find the equilibrium values of the given function. Hint: help roots 2. Plot the phase plot, dy/dt versus y, for y in increments of 0.01. Use the range given in the table above. Annotate the plot and all axes appropriately. You should use a linewidth of 2 and a red color plot line a. On the same plot show the equilibrium points as black stars b. Use legend to designate the phase plot and equilibrium points We next need to determine where dy/dt is positive and negative. Notice the actual plot may be hard to judge. One could use the + magnifier tool on the plot tool bar to help however we want to automate the process. Look up the "find" command and consider something like this Index pos- find(ydot> 0), 3. Generate the second panel of the subplot showing positive values as +1, negative values as -1, and the zero values (blue line). Again plot the equilibrium points as black stars phase plane y'vs.y 200 phase plot 150 100 50 50 100 sign y vs. y 0.5 sign of phase plot +equlibrium points -5 -3 4. In a separate cell in your Live Script, indicate the equilibrium points, their classification (stable, unstable, semi-stable) and their region of attraction/convergence (ROA) as shown in class Case function Range of y [-4.5, 2.8] dy dt 1. Using Matlab, find the equilibrium values of the given function. Hint: help roots 2. Plot the phase plot, dy/dt versus y, for y in increments of 0.01. Use the range given in the table above. Annotate the plot and all axes appropriately. You should use a linewidth of 2 and a red color plot line a. On the same plot show the equilibrium points as black stars b. Use legend to designate the phase plot and equilibrium points We next need to determine where dy/dt is positive and negative. Notice the actual plot may be hard to judge. One could use the + magnifier tool on the plot tool bar to help however we want to automate the process. Look up the "find" command and consider something like this Index pos- find(ydot> 0), 3. Generate the second panel of the subplot showing positive values as +1, negative values as -1, and the zero values (blue line). Again plot the equilibrium points as black stars phase plane y'vs.y 200 phase plot 150 100 50 50 100 sign y vs. y 0.5 sign of phase plot +equlibrium points -5 -3 4. In a separate cell in your Live Script, indicate the equilibrium points, their classification (stable, unstable, semi-stable) and their region of attraction/convergence (ROA) as shown in class
Step by Step Solution
There are 3 Steps involved in it

Get step-by-step solutions from verified subject matter experts