

Question: Help wanted on calculating the sample r and critical values. Thanks in advance. F > C mylab.pearson.com/Student/PlayerHomework.aspx?homeworkid=618602482&questionld=7&flushed=false&cld=6843907&back=DoAssignments.aspx #1: Apps G Gmail RY Maps Youtube X
Help wanted on calculating the sample r and critical values. Thanks in advance.
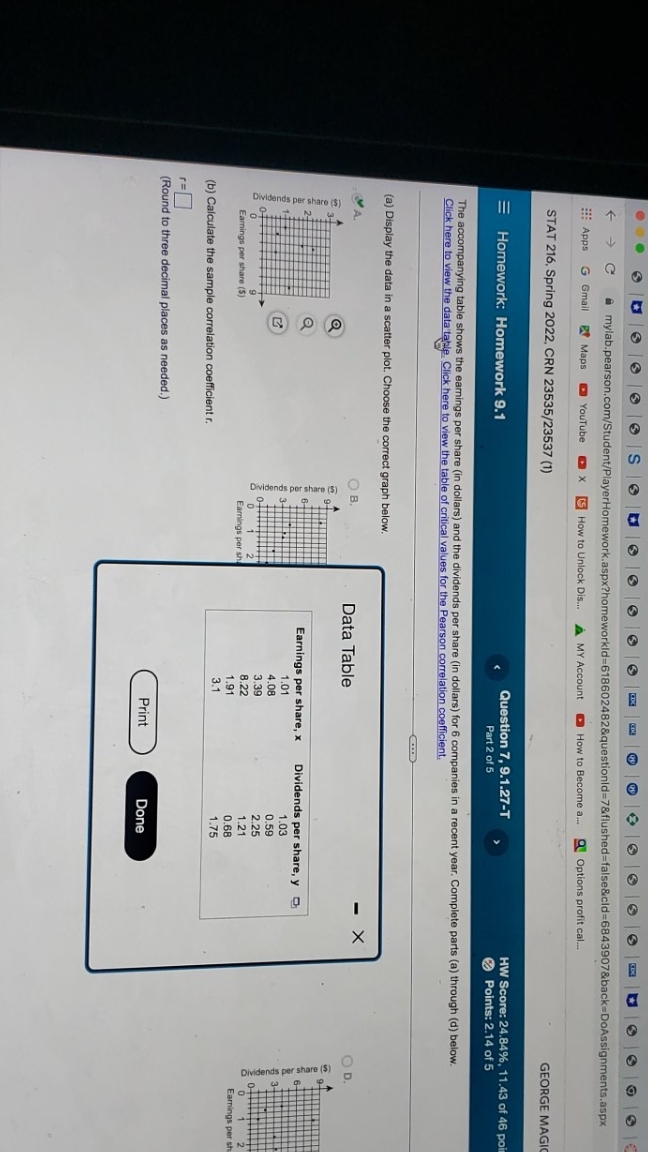
F > C mylab.pearson.com/Student/PlayerHomework.aspx?homeworkid=618602482&questionld=7&flushed=false&cld=6843907&back=DoAssignments.aspx #1: Apps G Gmail RY Maps Youtube X 5 How to Unlock Dis... MY Account How to Become a.. Q Options profit cal.. STAT 216, Spring 2022, CRN 23535/23537 (1) GEORGE MAGIC Homework: Homework 9.1 Question 7, 9.1.27-T HW Score: 24.84%, 11.43 of 46 po Part 2 of 5 Points: 2.14 of 5 The accompanying table shows the earnings per share (in dollars) and the dividends per share (in dollars) for 6 companies in a recent year. Complete parts (a) through (d) below. Click here to view the data table, Click here to view the table of critical values for the Pearson correlation coefficient. (a) Display the data in a scatter plot. Choose the correct graph below. A O B - X Data Table OD. Earnings per share, x Dividends per share, y Dividends per share ($) Dividends per share ($ Dividends per share ($) 1.01 .03 4.08 0.59 to 3.39 2.25 Fo 2 Earnings per share ($) Earnings per sh 8.22 1.21 1.91 0.68 Earnings per s 3.1 (b) Calculate the sample correlation coefficient r. 1.75 (Round to three decimal places as needed.) Print Done
Step by Step Solution
There are 3 Steps involved in it

Get step-by-step solutions from verified subject matter experts