

Question: Help with 1,2 Use the following information to answer the next The graph shows the change in position of an object over an 8.0 s
Help with 1,2
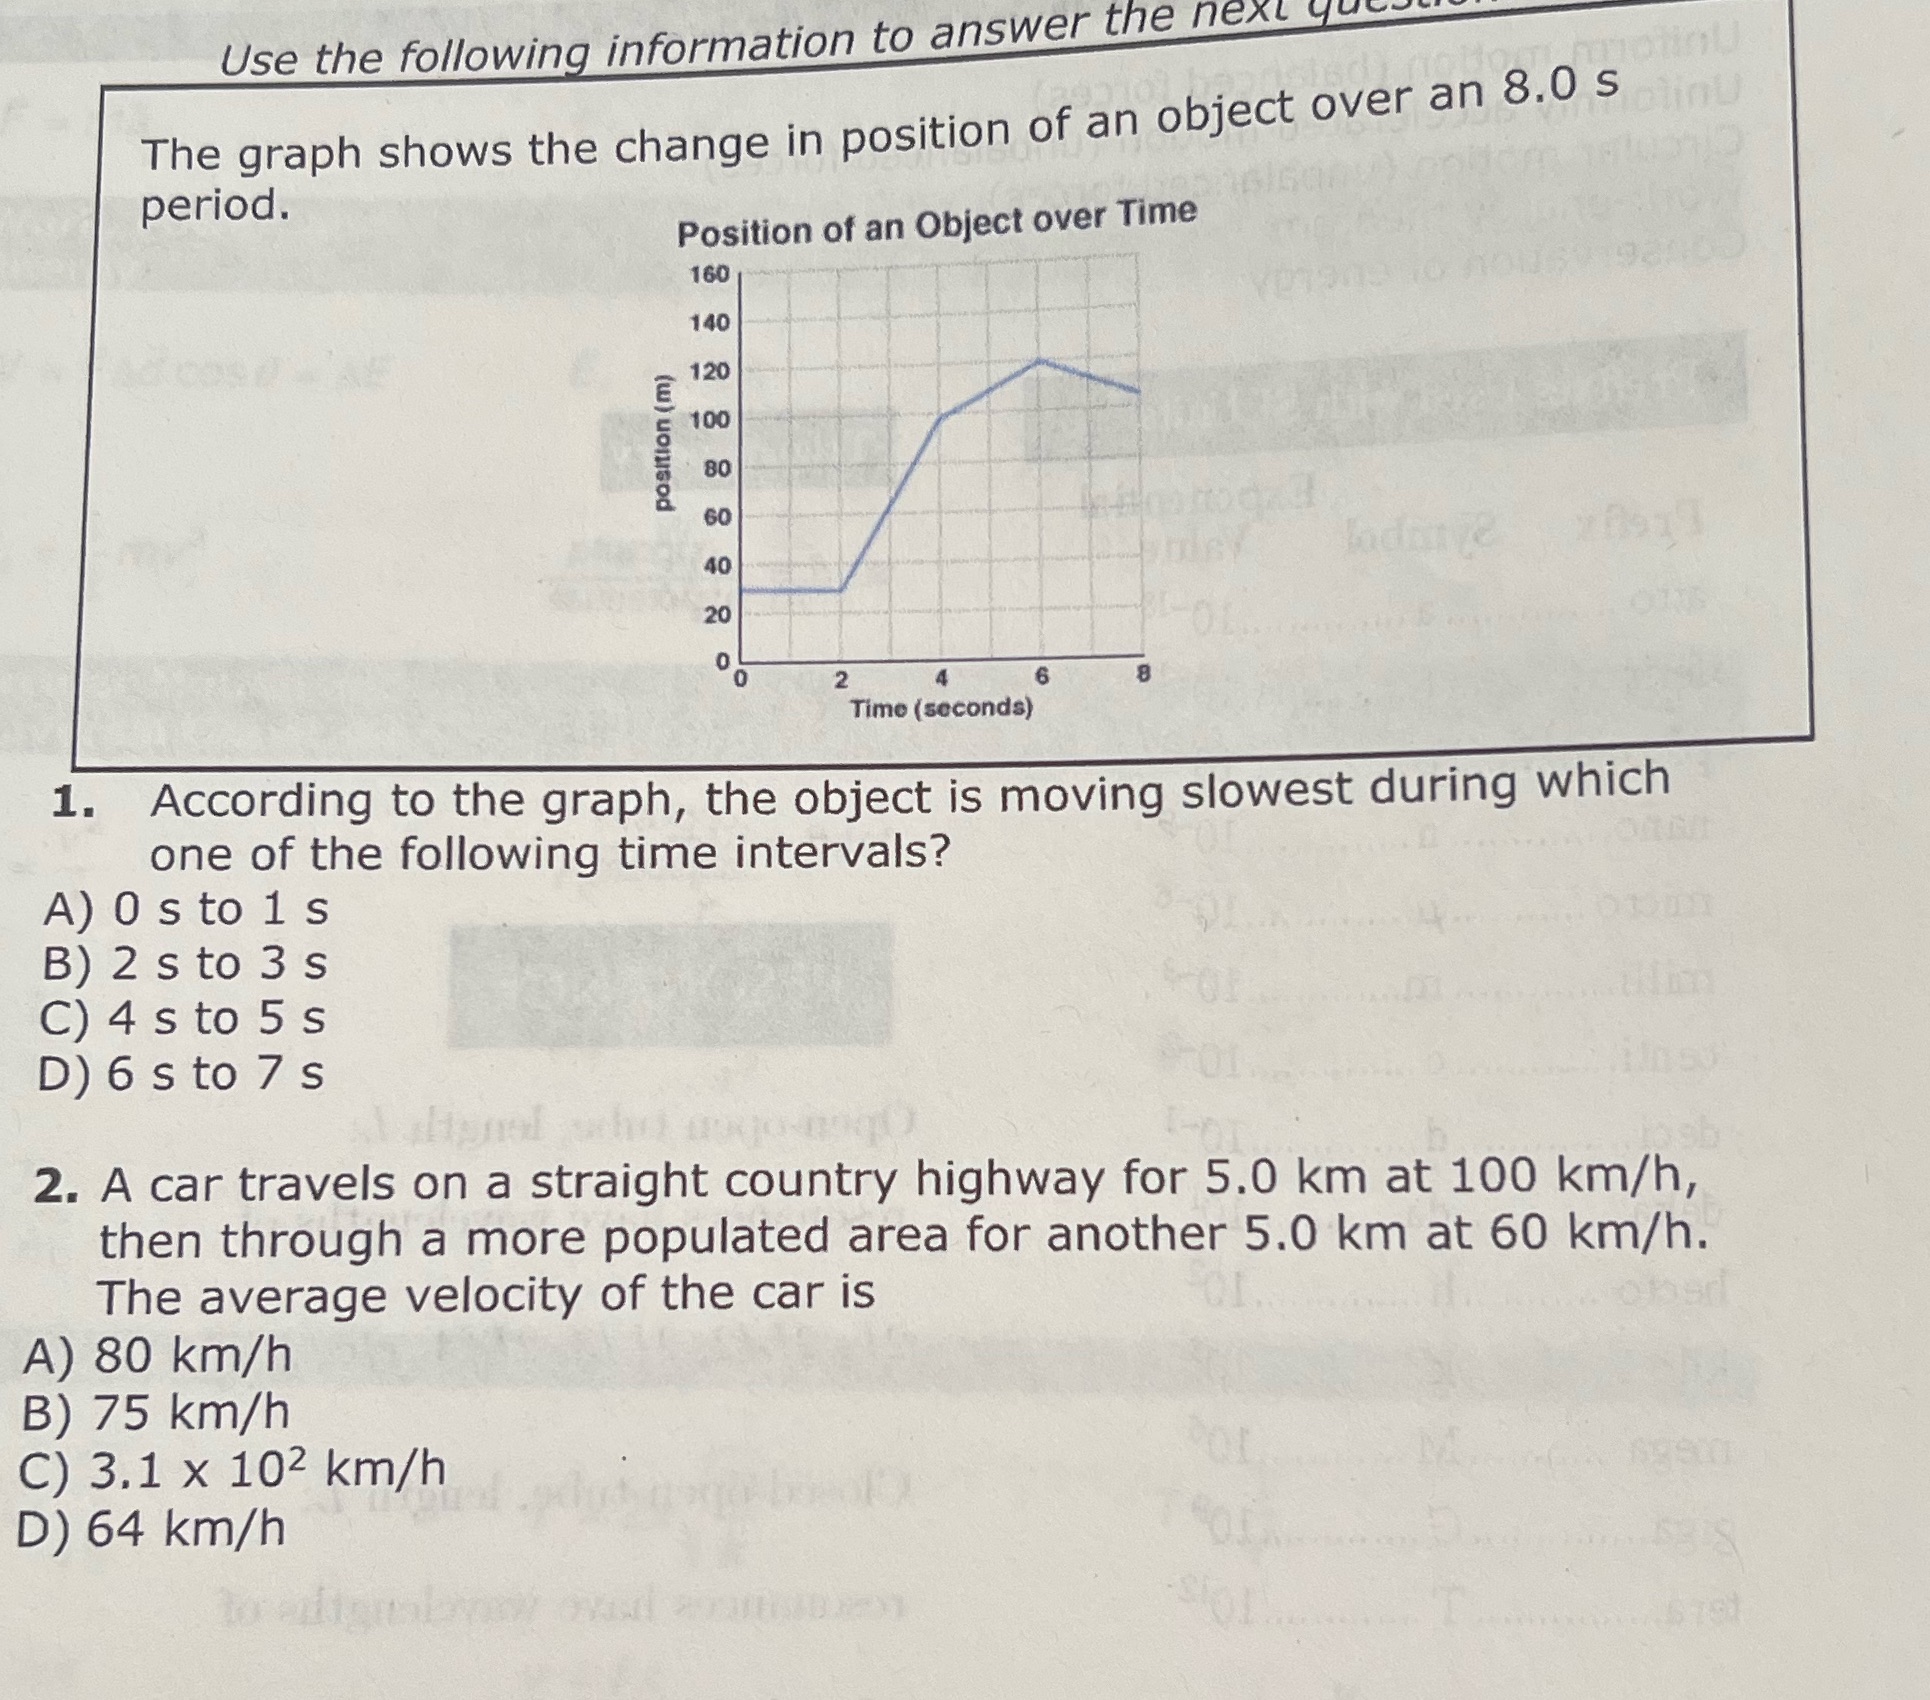
Use the following information to answer the next The graph shows the change in position of an object over an 8.0 s period. Position of an Object over Time 160 140 120 100 position (m) 80 60 20 Time (seconds) 1. According to the graph, the object is moving slowest during which one of the following time intervals? A) O s to 1 s B) 2 s to 3 s C) 4 s to 5 s D) 6 s to 7 s 2. A car travels on a straight country highway for 5.0 km at 100 km/h, then through a more populated area for another 5.0 km at 60 km/h. The average velocity of the car is A) 80 km/h B) 75 km/h C) 3.1 x 10² km/h Pot D) 64 km/h
Step by Step Solution
There are 3 Steps involved in it
1 Expert Approved Answer
Step: 1 Unlock

Question Has Been Solved by an Expert!
Get step-by-step solutions from verified subject matter experts
Step: 2 Unlock
Step: 3 Unlock