

Question: *HELP WITH MATHEMATICA CODES* PLEASE Very often when graphing functions, you need to carefully choose a viewing window in order to see all of the
*HELP WITH MATHEMATICA CODES*PLEASE
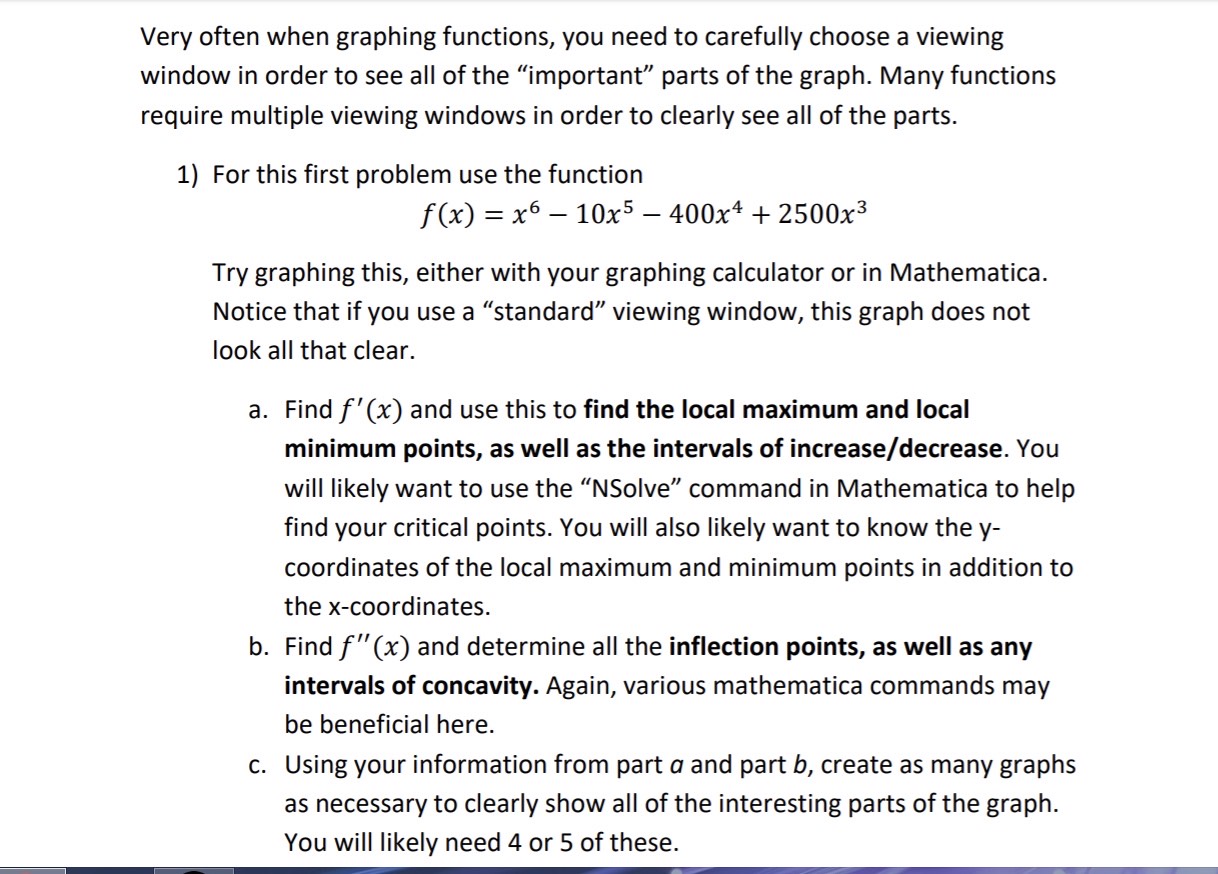
Very often when graphing functions, you need to carefully choose a viewing window in order to see all of the \"important\" parts of the graph. Many functions require multiple viewing windows in order to clearly see all of the parts. 1) For this first problem use the function f(x) = x5 10x5 4001c\" + 2500x3 Try graphing this, either with your graphing calculator or in Mathematica. Notice that if you use a \"standa rd\" viewing window, this graph does not look all that clear. a. Find f'(x) and use this to find the local maximum and local minimum points, as well as the intervals of increase/decrease. You will likely want to use the \"NSolve\" command in Mathematica to help find your critical points. You will also likely want to know the y- coordinates of the local maximum and minimum points in addition to the xcoordinates. b. Find f "(x) and determine all the inection points. as well as any intervals of concavity. Again, various mathematica commands may be beneficial here. c. Using your information from part a and part b, create as many graphs as necessary to clearly show all of the interesting parts of the graph. You will likely need 4 or 5 of these
Step by Step Solution
There are 3 Steps involved in it

Get step-by-step solutions from verified subject matter experts