

Question: help with project Roll a 7 - sided dioe Part A: Theoretically, if you roll a 7sided die and variable x is the outcomes. the
help with project
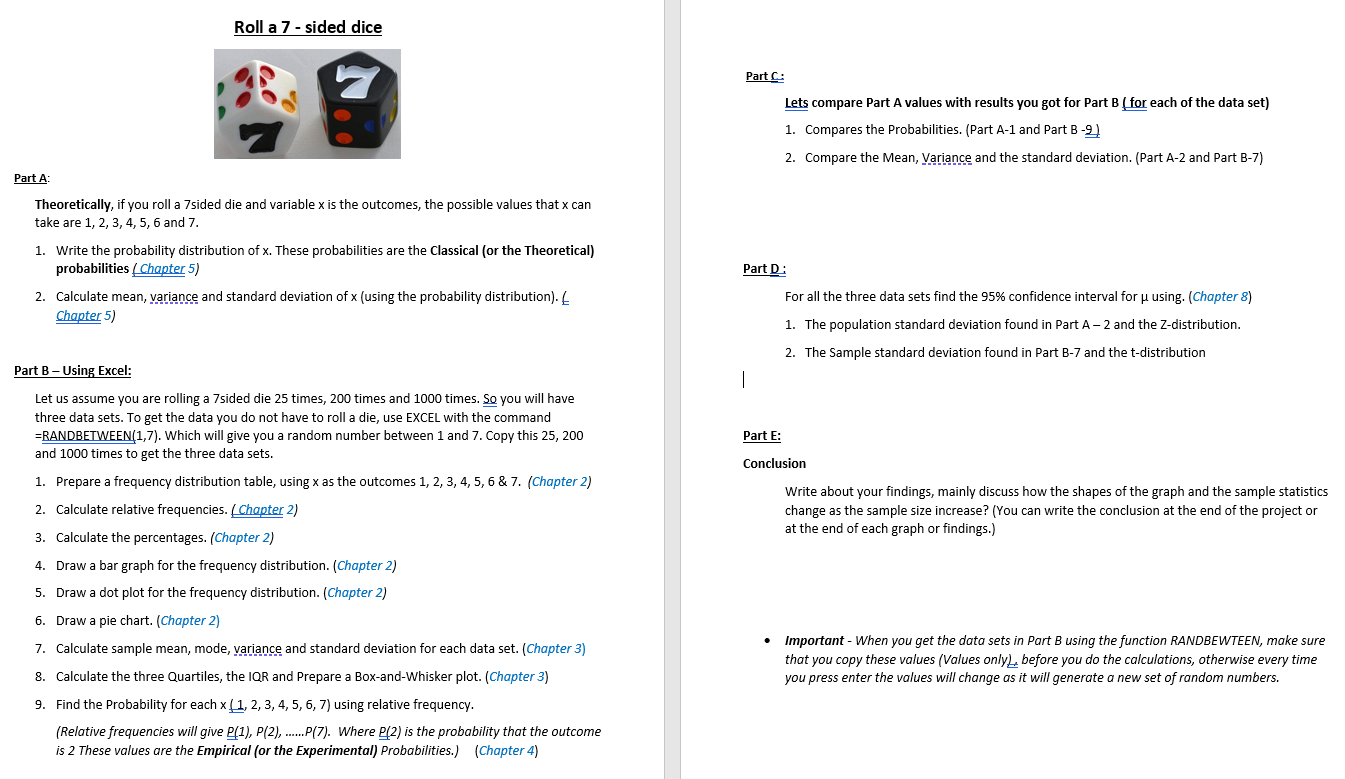
Roll a 7 - sided dioe Part A: Theoretically, if you roll a 7sided die and variable x is the outcomes. the possible values that x can take are l. 2. 3, 4, 5. 6 and T. 1. Write the probability distribution of x. These probabilities are the Classical [or the Theoreli-I} probabililies M5} 2. Calculate mean. 313-: e and standard deviation of K [using the probability distribution}. L M5} Parl B 7 Using Excel: Let us assume you are rolling a 7sided die 25 times, 200 tima and 1000 times. g you will have three data sets. To get the data you do not have to roll a die, use EXCEL with the command =wll). which will give you a random number between 1 and 7. Copy this 25. 20:] and 1000 times to get the three data sets. 1. Prepare a frequency distribution table. using it as the outcomes 1, 2. 3. 4, 5, 6 8t 7. {Chapter 2} 2. Calculate relative frequencies. {Ling 2) Calculate the pe reentages. {Chapter 2) Draw a bar graph for the frequency distribution. [Chapterzj Draw a dot plot for the frequency distribution. {Chapter 2} Draw a pie chart. [Chapter 2} Calculate sample mean, mode, y_a_r_i_a_r_lg:_e_ and standard deviation for each data set. {Chapter 3] Calculate the three Quartiles, the IOR and Prepare a Box-and-whisker plot. {Chapter3} 5090:4999.\" Find the Probability for each X Li- 2. 3. 4, 5, 6. 7] using relative frequency. {Relative 'equericies wifi give gm. sz), . PM. Where g2} is the probability that the outcome is 2 These values are the Enrpr'rith [or the Experimental} Probabilities.) (Chapterdl Par\";- @ compare Part A values with results you got for Part B Lg each of the data set) 1. Compares the Probabilities. [Part A71 and Part 37;! 2. Compare the Mean. Maange and the standard deviation. [Part A2 and Part 3-7] Part D_: For all the three data sets find the 95% condence interval for p using. [Chapter 8} 1. The population standard deviation found in Part A 2 and the Zdistrihution. 2. The Sample standard deviation found in Part 377 and the tdislribution Part E: Conclusion Write about your ndings, mainly discuss how the shapes ofthe graph and the sample statistits change as the sample size increase? [You can write the conclusion at the end ofthe project or at the end of each graph or ndings.) I important - when you get the data sets in Part B using the function RANDBEWTEEN. make sure that you copy these values [Values oniy before you do the cofcaiatibm, otherwise every time you press enter the vaiues wilt change as it wiii' generate a new set ofmndorn n timbers
Step by Step Solution
There are 3 Steps involved in it

Get step-by-step solutions from verified subject matter experts