

Question: Part A : Theoretically , if you roll a 7sided die and variable x is the outcomes, the possible values that x can take are
Part A:
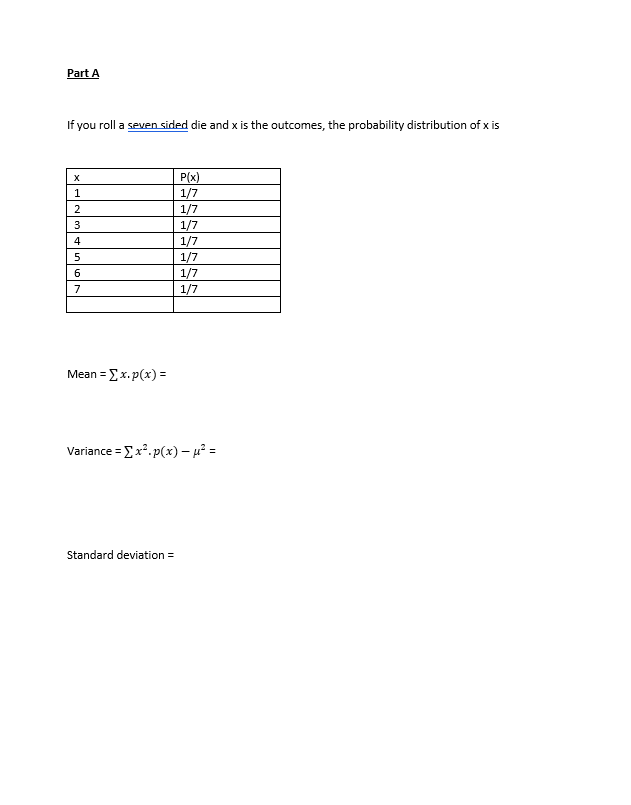
Theoretically, if you roll a 7sided die and variable x is the outcomes, the possible values that x can take are 1, 2, 3, 4, 5, 6 and 7.
- Write the probability distribution of x. These probabilities are the Classical (or the Theoretical) probabilities ( Chapter 5)
- Calculate mean, variance and standard deviation of x (using the probability distribution). ( Chapter 5)
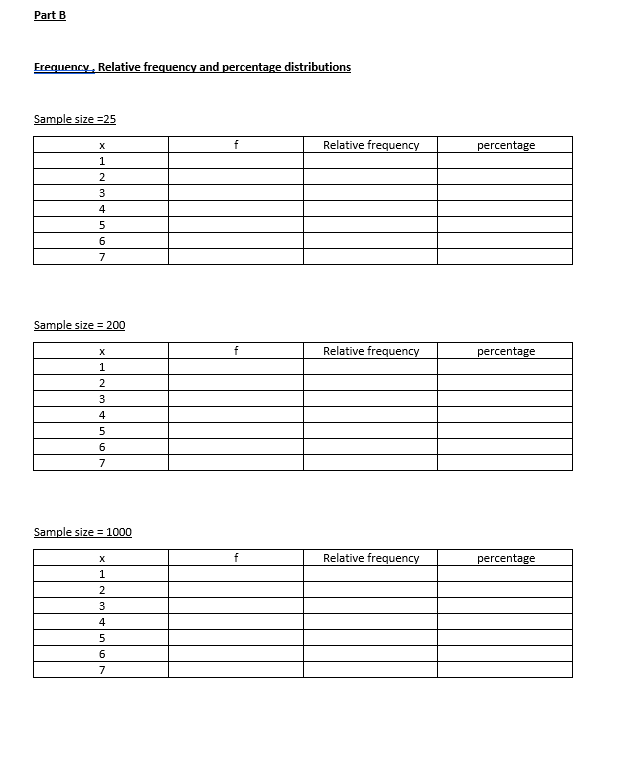
Part B - Using Excel:
Let us assume you are rolling a 7sided die 25 times, 200 times and 1000 times. So you will have three data sets. To get the data you do not have to roll a die, use EXCEL with the command =RANDBETWEEN(1,7). Which will give you a random number between 1 and 7. Copy this 25, 200 and 1000 times to get the three data sets.
- Prepare frequency distribution table, using x as the outcomes 1, 2, 3, 4, 5, 6 & 7.(Chapter 2)
- Calculate relative frequencies. ( Chapter 2)
- Calculate the percentages. (Chapter 2)
- Draw a bar graph for the frequency distribution. (Chapter 2)
- Draw a dot plot for the frequency distribution. (Chapter 2)
- Draw a pie chart. (Chapter 2)
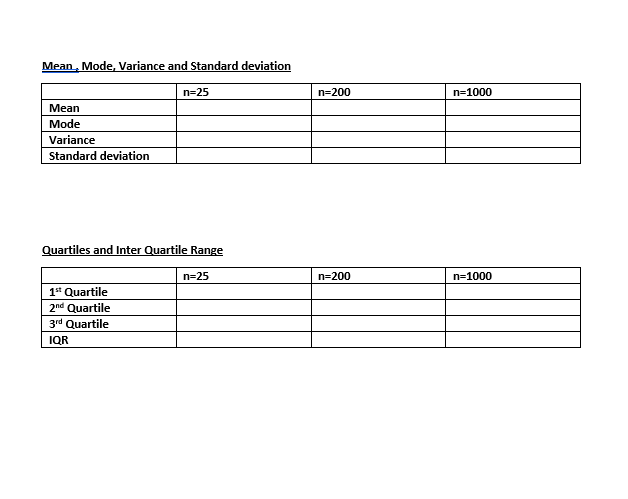
- Calculate sample mean, mode, variance and standard deviation for each data set. (Chapter 3)
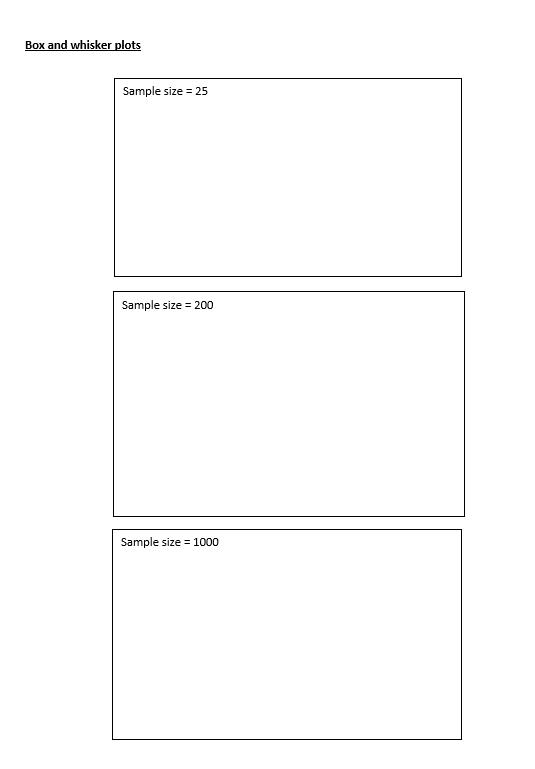
- Calculate the three Quartiles, the IQR and Prepare Box-and-Whisker plot. (Chapter 3)
- Find the Probability for each x ( 1, 2, 3, 4, 5, 6, 7) using relative frequency.
(Relative frequencies will give P(1), P(2), ......P(7).Where P(2) is the probability that the outcome is 2 These values are the Empirical (or the Experimental) Probabilities.)(Chapter 4)
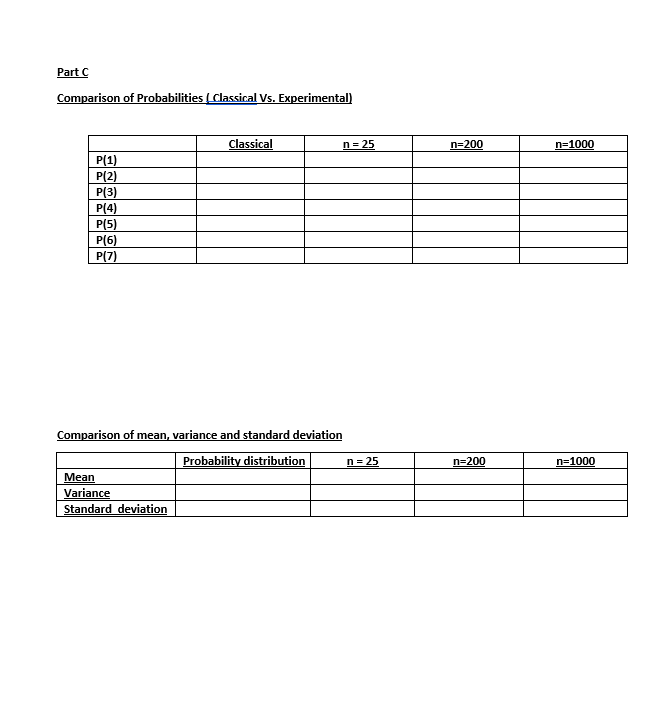
Part C :
Lets compare Part A values with results you got for Part B ( for each of the data set)
1.Compares the Probabilities. (Part A-1 and Part B -9 )
2.Compare the Mean, Variance and the standard deviation. (Part A-2 and Part B-7)
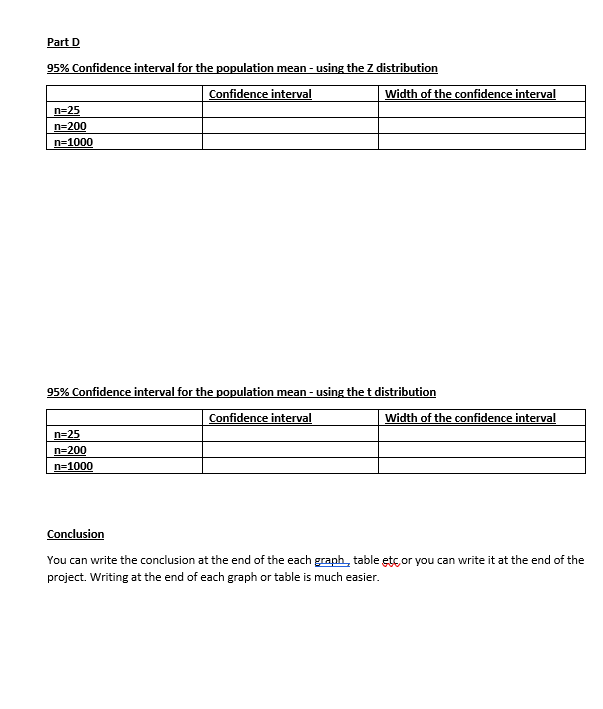
Part D :
For all the three data sets find the 95% confidence interval for using. (Chapter 8)
1.The population standard deviation found in Part A - 2 and the Z-distribution.
2.The Sample standard deviation found in Part B-7 and the t-distribution
Part E:
Conclusion
Write about your findings, mainly discuss how the shapes of the graph and the sample statistics change as the sample size increase? (You can write the conclusion at the end of the project or at the end of each graph or findings.)
These are the instructions
Frequency bar graphs O O Sample size = 25 Sample size = 200 Sample size = 1000Dot plot Sample size = 25 Sample size = 200 Sample size = 1000\fPart A If you roll a seven sided die and x is the outcomes, the probability distribution of x is X P(x) 1 1/7 2 1/7 3 1/7 4 1/7 5 1/7 6 1/7 7 1/7 Mean = [ x. p(x) = Variance = [ x3. p(x) - #3 = Standard deviation =Part B Frequency , Relative frequency and percentage distributions Sample size =25 X f Relative frequency percentage Sample size = 200 X f Relative frequency percentage 1 Sample size = 1000 X f Relative frequency percentageMean , Mode, Variance and Standard deviation n=25 n=200 n=1000 Mean Mode Variance Standard deviation Quartiles and Inter Quartile Range n=25 n=200 n=1000 1" Quartile and Quartile 3d Quartile IOR\fPart C Comparison of Probabilities ( Classical Vs. Experimental] Classical n = 25 n=200 n=1000 P(1 P (2) P(3) P(4) P(5) P (6) P(7) Comparison of mean, variance and standard deviation Probability distribution n = 25 1=200 1=1000 Mean Variance Standard deviationPart D 95% Confidence interval for the population mean - using the Z distribution Confidence interval Width of the confidence interval n=25 n=200 n=1000 95% Confidence interval for the population mean - using the t distribution Confidence interval Width of the confidence interval n=25 n=200 n=1000 Conclusion You can write the conclusion at the end of the each graph, table etc or you can write it at the end of the project. Writing at the end of each graph or table is much easier
Step by Step Solution
There are 3 Steps involved in it

Get step-by-step solutions from verified subject matter experts