

Question: Help with question 2 plotting on matlab We have an old noisy generator that generates 10Hz sine waves with an amplitude of 3 v. The
Help with question 2 plotting on matlab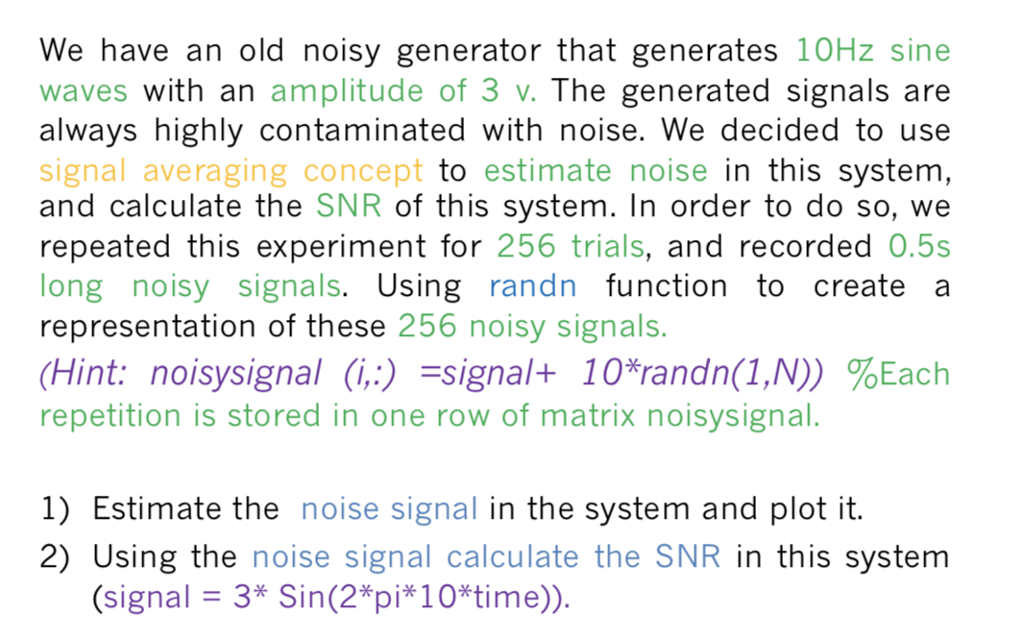
We have an old noisy generator that generates 10Hz sine waves with an amplitude of 3 v. The generated signals are always highly contaminated with noise. We decided to use signal averaging concept to estimate noise in this system, and calculate the SNR of this system. In order to do so, we repeated this experiment for 256 trials, and recorded 0.5s long noisy signals. Using randn function to create a representation of these 256 noisy signals. (Hint: noisysignal (i.) -signal+ 10%randn(1,N)) %Each repetition is stored in one row of matrix noisysignal 1) Estimate the noise signal in the system and plot it. 2) Using the noise signal calculate the SNR in this system (signal-3" Sin(2tpi*10*time))
Step by Step Solution
There are 3 Steps involved in it

Get step-by-step solutions from verified subject matter experts