

Question: I need help with question 2 which is determinng the value of pKa for each acid from the titration curve Data Table 1. 83 #2
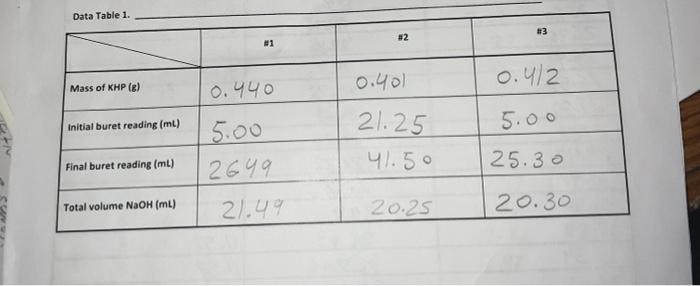
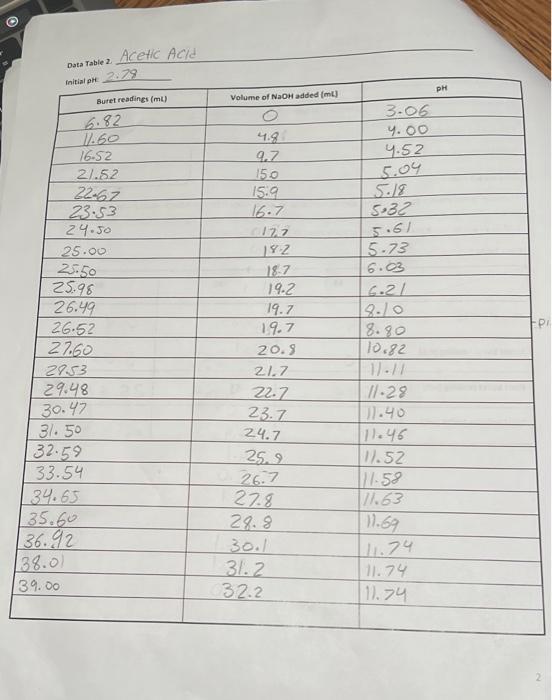
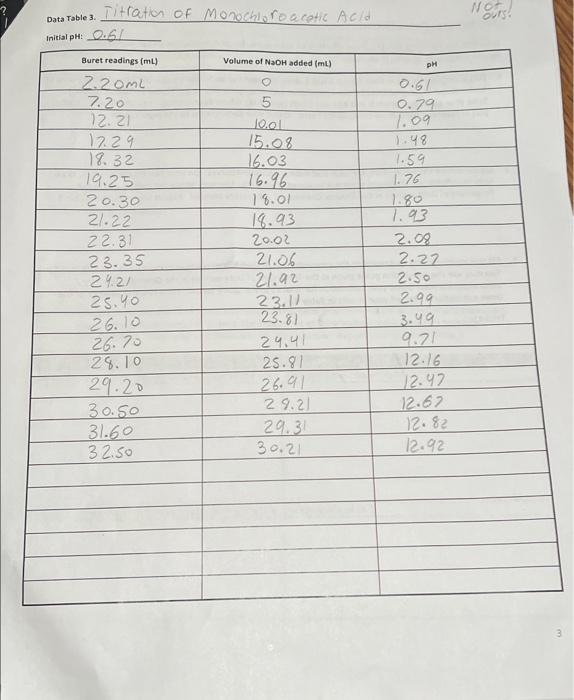
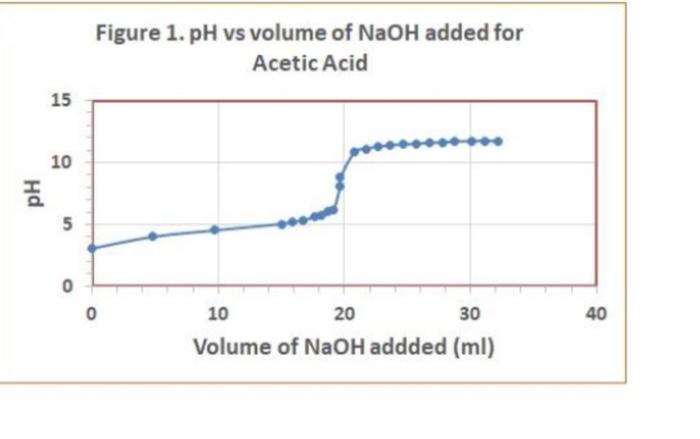
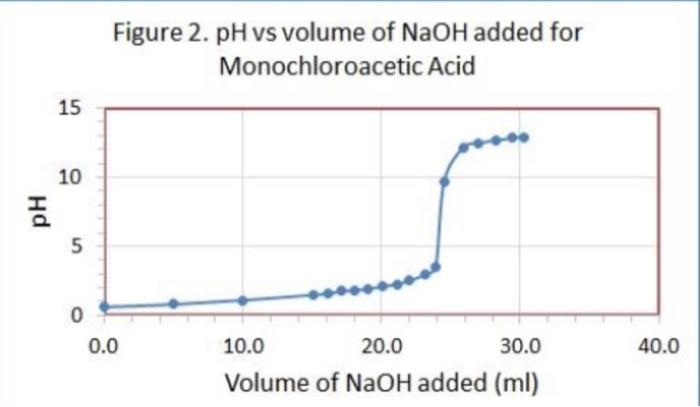
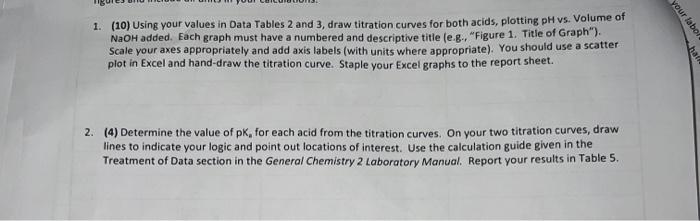
Data Table 1. 83 #2 81 0.40) 0.4/2 Mass of KHP (e) 0.440 Initial buret reading (ml) 5.00 21.25 41.50 Final buret reading (ml) 5.00 2649 21.49 25.30 Total volume NaOH (ml) 20.25 20.30 Acetic Acid Data Table 2 Initial p 2.29 PH Buret readings (ml) Volume of NaOH added (ml) 6.82 3.06 4.00 4.52 9.7 150 15.9 16.7 5.18 5:32 5.61 5.73 6.21 8.80 10.82 11.60 16.52 21.52 22.67 23.53 24.50 25.00 25.50 25.98 26.49 26.52 27.60 2753 29.48 30.47 31. 50 132.59 33.54 34.65 135.60 36.92 138.00 39.00 182 18.7 19.2 19.7 19.7 20.5 21.7 22.7 23.7 24.7 25.2 26.7 27.8 28.8 30.1 31.2 32.2 // -29 11.40 [11.46 W.52 177.58 17.63 11.69 111.74 11.74 111.74 Titration of Monochloroacetic Acid Noors Data Table 3. Initial pH: 0.6/ Volume of NaOH added (ml) Buret readings (ml) 2.20ML 7.20 12.21 17.29 18.32 19.25 20.30 21.22 22.31 23.35 24.21 25. 26.10 26.70 28.10 29.20 30.50 31.60 32.50 5 Jool 15.08 16.03 16.96 18.01 18.93 20.02 21.06 21.92 23.11 23.81 29.41 25.81 26.91 29.21 29.31 30.21 pH O.GL 0.79 1.09 1.48 1.59 1.76 1.80 1.93 2.08 2.27 2.50 2.99 3.49 9.21 12.16 12.47 12.67 12.82 12.92 3 Figure 1. pH vs volume of NaOH added for Acetic Acid 15 10 Hd 5 0 0 20 40 10 30 Volume of NaOH addded (ml) Figure 2. pH vs volume of NaOH added for Monochloroacetic Acid 15 10 Hd 5 5 O 0 0.0 40.0 10.0 20.0 30.0 Volume of NaOH added (ml) 1. (10) Using your values in Data Tables 2 and 3, draw titration curves for both acids, plotting pH vs. Volume of NaOH added. Each graph must have a numbered and descriptive title leg., "Figure 1. Title of Graph"). Scale your axes appropriately and add axis labels (with units where appropriate). You should use a scatter plot in Excel and hand-draw the titration curve. Staple your Excel graphs to the report sheet. your labor Nard 2. (4) Determine the value of pK, for each acid from the titration curves. On your two titration curves, draw lines to indicate your logic and point out locations of interest. Use the calculation guide given in the Treatment of Data section in the General Chemistry 2 Laboratory Manual Report your results in Table 5
Step by Step Solution
There are 3 Steps involved in it

Get step-by-step solutions from verified subject matter experts