

Question: help with question 8 please 228 CHAPTER 6. Statistical Quality Control per bottle. If the average range for the four samples is 04 ounce and
help with question 8 please
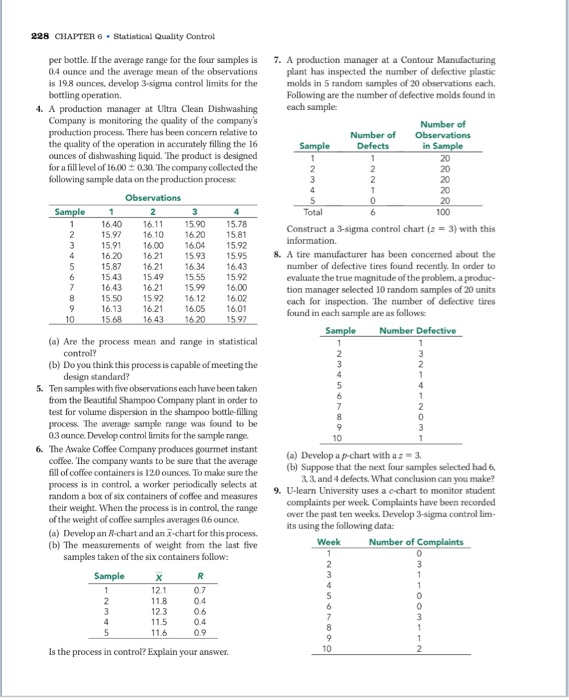
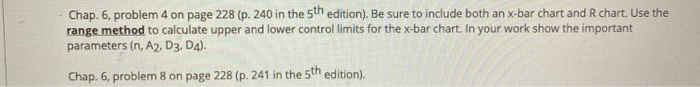
228 CHAPTER 6. Statistical Quality Control per bottle. If the average range for the four samples is 04 ounce and the average mean of the observations is 19.8 ounces, develop 3-sigma control limits for the bottling operation. 4. A production manager at Ultra Clean Dishwashing Company is monitoring the quality of the company's production process. There has been concern relative to the quality of the operation in accurately filling the 16 ounces of dishwashing liquid. The product is designed for a fill level of 16.00 0.30. The company collected the following sample data on the production process 7. A production manager at a Contour Manufacturing p lant has inspected the number of defective plastic molds in 5 random samples of 20 observations each. Following are the number of defective molds found in each sample: Number of Number of Observations Sample Defects in Sample 20 Sample Total 4 15.78 15.81 1592 Observations 1 2 3 16,40 16.11 15.90 15.97 16.10 16.20 15.91 1600 16.04 16.20 16 21 15.93 1621 16.34 15.43 15.49 15.55 16.43 16 21 15 99 15.50 15.92 16.12 16.13 16 21 16.05 15 68 16 43 16.20 15 87 6 15.95 16.43 15.92 16.00 16.02 16.01 15.97 Construct a 3-sigma control chart (z = 3) with this information 8. A tire manufacturer has been concerned about the number of defective tires found recently. In order to evaluate the true magnitude of the problem, a produc- tion manager selected 10 random samples of 20 units cach for inspection. The number of defective tires found in each sample are as follows: Sample Number Defective 9 10 WONNU (a) Are the process mean and range in statistical control? (b) Do you think this process is capable of meeting the design standard? 5. Ten samples with five observations each have been taken from the Beautiful Shampoo Company plant in order to test for volume dispersion in the shampoo bottle-filling process. The average sample range was found to be 03 ounce. Develop controllimits for the sample range. 6. The Awake Coffee Company produces gourmet instant coffee. The company wants to be sure that the average fill of coffee containers is 12.0 ounces. To make sure the process is in control, a worker periodically selects at random a box of six containers of coffee and measures their weight. When the process is in control, the range of the weight of coffee samples averages 0.6 ounce. (a) Develop an R-chart and an X-chart for this process. (b) The measurements of weight from the last five samples taken of the six containers follow: (a) Develop a p-chart with a -3 (b) Suppose that the next four samples selected had 6, 3.3, and 4 defects. What conclusion can you make? 9. U-learn University uses a c.chart to monitor student complaints per week. Complaints have been recorded over the past ten weeks. Develop 3-sigma controllim- its using the following data: Week Number of Complaints Sample 12.1 07 118 0.4 0.6 123 11.5 11.6 OOO OWN N-WOO 0.9 Is the process in control? Explain your answer. Chap. 6, problem 4 on page 228 (p. 240 in the 5th edition). Be sure to include both an x-bar chart and chart. Use the range method to calculate upper and lower control limits for the x-bar chart. In your work show the important parameters (n,A2, D3, D4). Chap. 6, problem 8 on page 228 (p. 241 in the 5th edition) Step by Step Solution
There are 3 Steps involved in it
1 Expert Approved Answer
Step: 1 Unlock

Question Has Been Solved by an Expert!
Get step-by-step solutions from verified subject matter experts
Step: 2 Unlock
Step: 3 Unlock