

Question: Help with the following Calculus question please... To estimate k and L in a logistic curve, dp = kP we can use a scatterplot of
Help with the following Calculus question please...
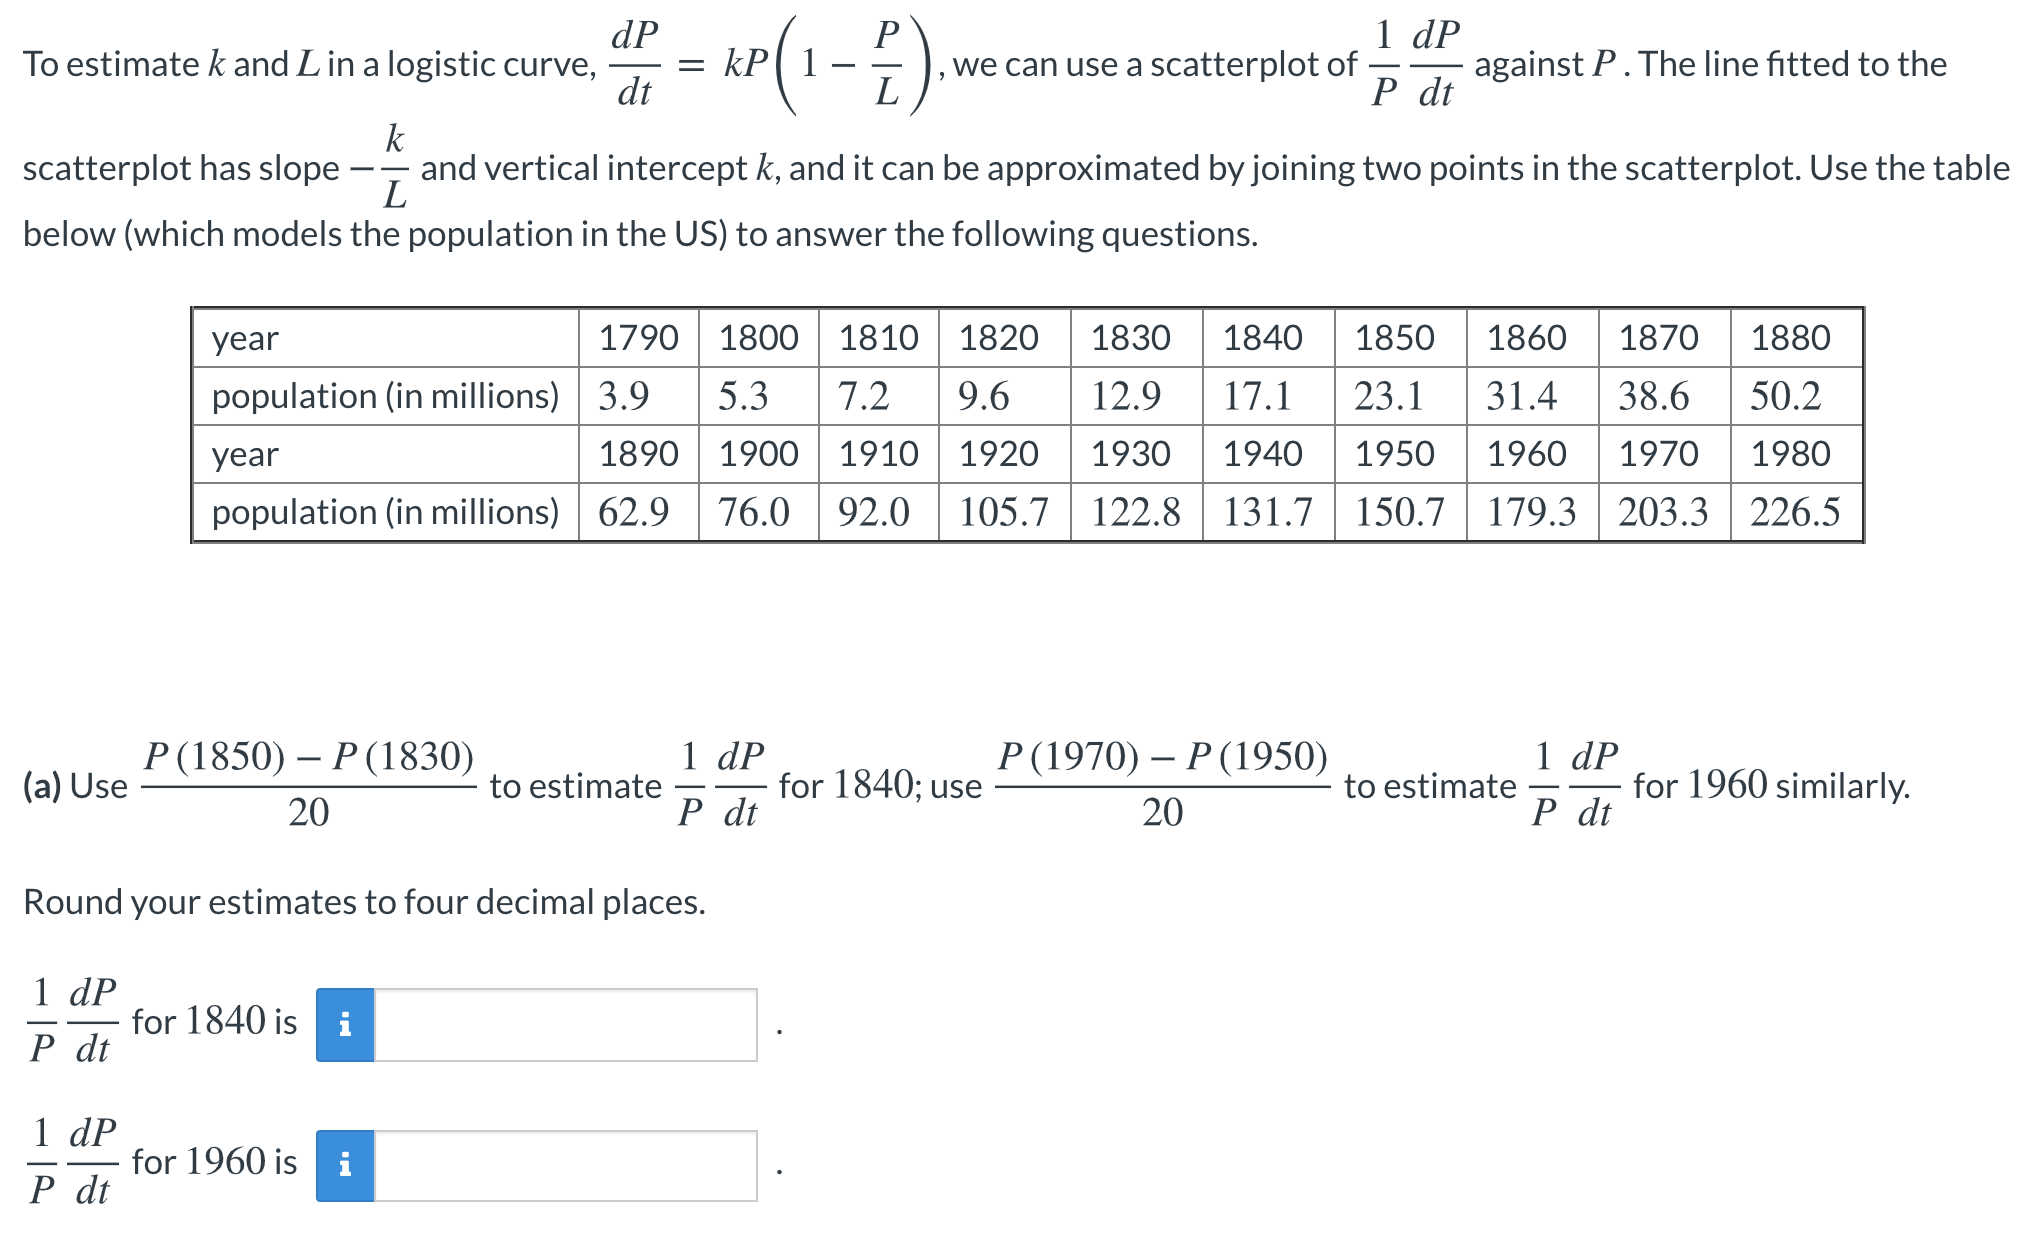
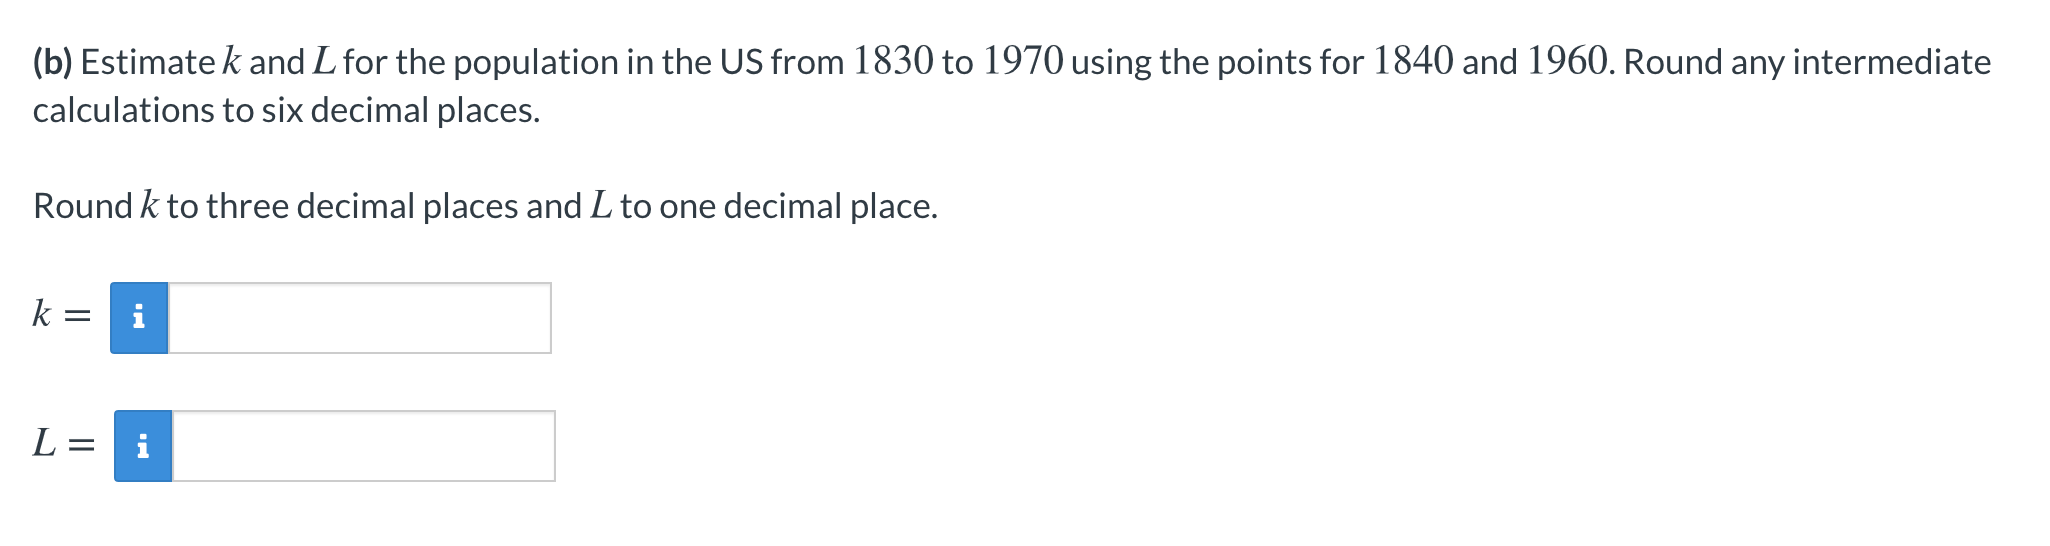
To estimate k and L in a logistic curve, dp = kP we can use a scatterplot of I dp dt P dt against P . The line fitted to the k scatterplot has slope - - and vertical intercept k, and it can be approximated by joining two points in the scatterplot. Use the table below (which models the population in the US) to answer the following questions. year 1790 1800 1810 1820 1830 1840 1850 1860 1870 1880 population (in millions) 3.9 5.3 7.2 9.6 12.9 17.1 23.1 31.4 38.6 50.2 year 1890 1900 1910 1920 1930 1940 1950 1960 1970 1980 population (in millions) 62.9 76.0 92.0 105.7 122.8 131.7 150.7 179.3 203.3 226.5 (a) Use P (1850) - P (1830) to estimate 1 dP for 1840; use P (1970) - P (1950) 1 dP 20 P dt 20 to estimate P dt for 1960 similarly. Round your estimates to four decimal places. 1 dP P dt for 1840 is i 1 dP P dt for 1960 is i(b) Estimate k and L for the population in the US from 1830 to 1970 using the points for 1840 and 1960. Round any intermediate calculations to six decimal places. Round k to three decimal places and L to one decimal place. k = i L =
Step by Step Solution
There are 3 Steps involved in it

Get step-by-step solutions from verified subject matter experts