

Question: Help with the MATLAB code to produce graphs in fig1 and fig2 Table 1 Fig. 2. The optimal portfolio weights on nominal bonds, stocks, indexed
 Help with the MATLAB code to produce graphs in fig1 and fig2
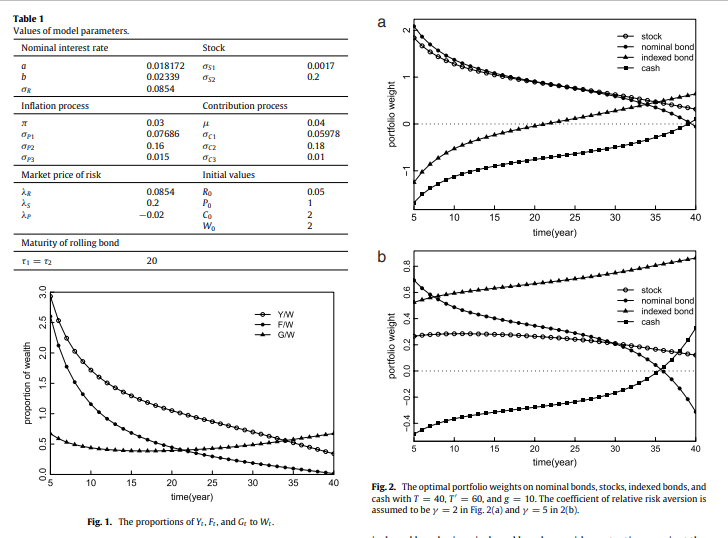
Table 1 Fig. 2. The optimal portfolio weights on nominal bonds, stocks, indexed bonds, and cash with T=40,T=60, and g=10. The coefficient of relative risk aversion is assumed to be y=2 in Fig. 2(a) and y=5 in 2(b). Fig. 1. The proportions of Yt,Ft, and Gt to Wt- Table 1 Fig. 2. The optimal portfolio weights on nominal bonds, stocks, indexed bonds, and cash with T=40,T=60, and g=10. The coefficient of relative risk aversion is assumed to be y=2 in Fig. 2(a) and y=5 in 2(b). Fig. 1. The proportions of Yt,Ft, and Gt to Wt-
Step by Step Solution
There are 3 Steps involved in it
1 Expert Approved Answer
Step: 1 Unlock

Question Has Been Solved by an Expert!
Get step-by-step solutions from verified subject matter experts
Step: 2 Unlock
Step: 3 Unlock