

Question: HELP with the x-chart this is my 3rd time posting it and it's still wrong, could you also explain how you got the answer thanks
HELP with the x-chart this is my 3rd time posting it and it's still wrong, could you also explain how you got the answer thanks :)
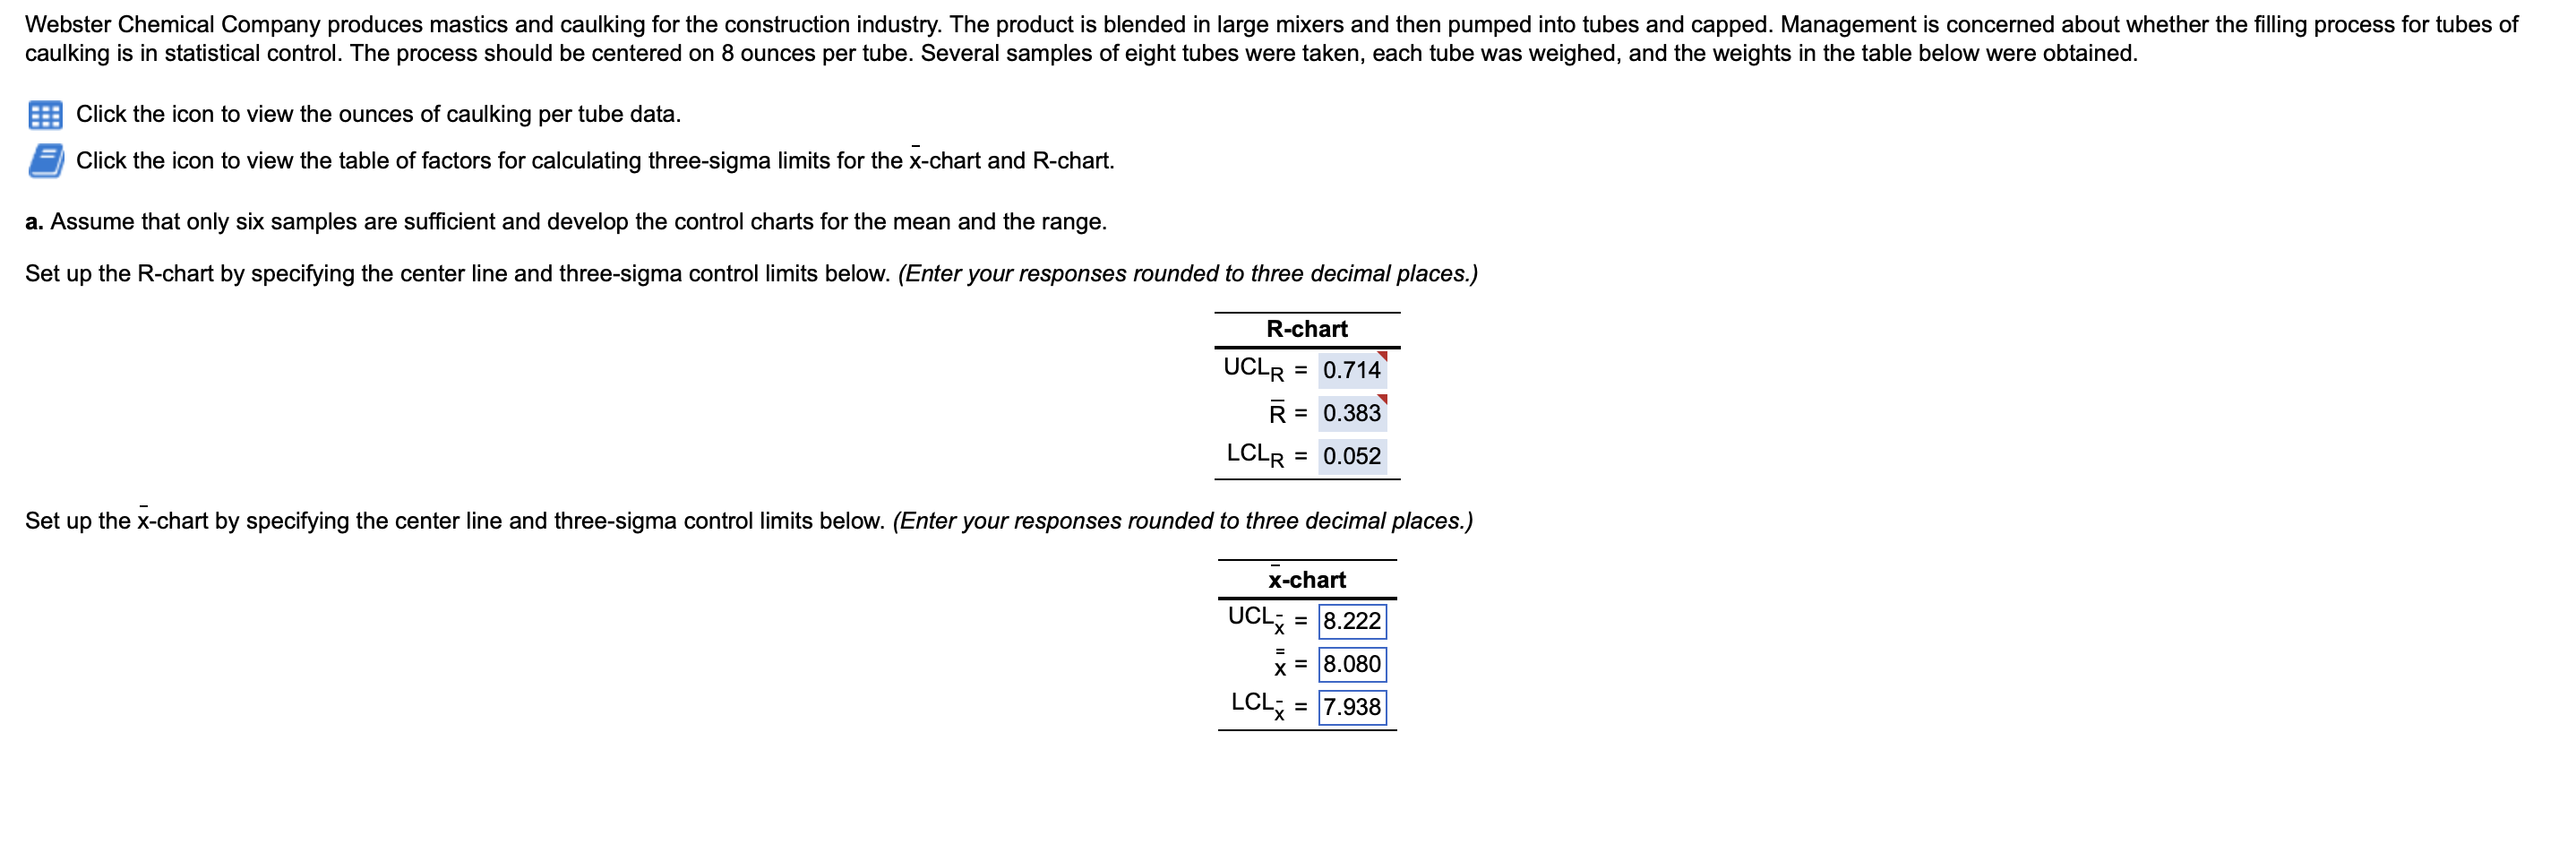
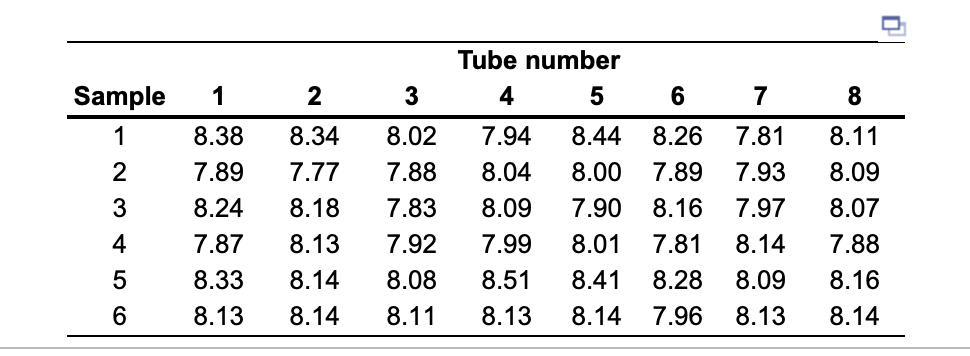
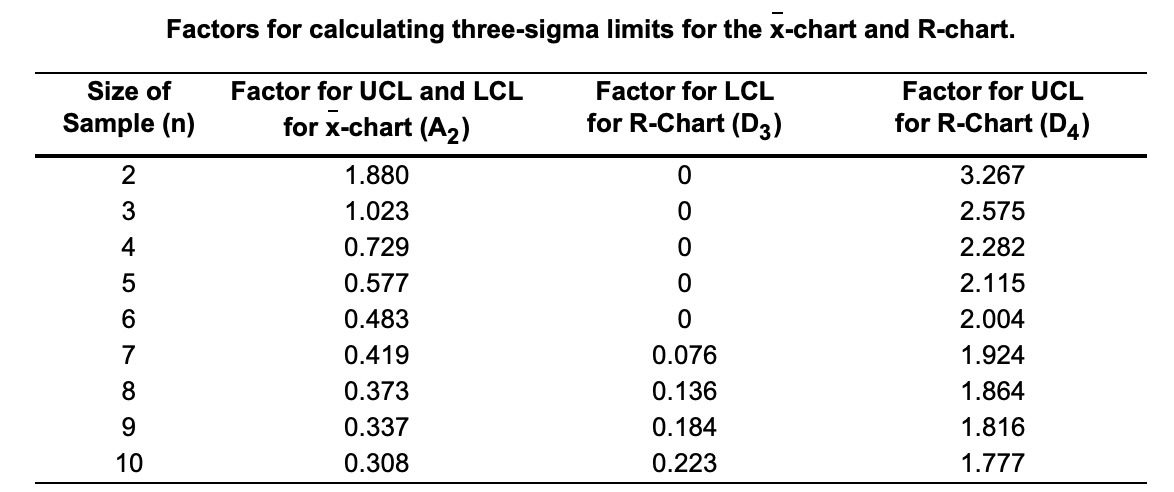
Webster Chemical Company produces mastics and caulking for the construction industry. The product is blended in large mixers and then pumped into tubes and capped. Management is concerned about whether the filling process for tubes of caulking is in statistical control. The process should be centered on 8 ounces per tube. Several samples of eight tubes were taken, each tube was weighed, and the weights in the table below were obtained. Click the icon to view the ounces of caulking per tube data. Click the icon to view the table of factors for calculating three-sigma limits for the x-chart and R-chart. a. Assume that only six samples are sufficient and develop the control charts for the mean and the range. Set up the R-chart by specifying the center line and three-sigma control limits below. (Enter your responses rounded to three decimal places.) R-chart UCLR = 0.714 R = 0.383 LCLR = 0.052 Set up the x-chart by specifying the center line and three-sigma control limits below. (Enter your responses rounded to three decimal places.) x-chart UCLX = 8.222 = X = 8.080 LCL = 7.938 Sample 1 2 3 4 5 6 Tube number 3 4 5 6 7 8.02 7.94 8.44 8.26 7.81 7.88 8.04 8.00 7.89 7.93 7.83 8.09 7.90 8.16 7.97 7.92 7.99 8.01 7.81 8.14 8.51 8.41 8.28 8.09 8.13 8.14 7.96 8.13 1 2 8.38 8.34 7.89 7.77 8.24 8.18 7.87 8.13 8.33 8.14 8.08 8.13 8.14 8.11 8 8.11 8.09 8.07 7.88 8.16 8.14 Size of Sample (n) 2 3 456789 Factors for calculating three-sigma limits for the x-chart and R-chart. Factor for UCL and LCL Factor for LCL for R-Chart (D3) Factor for UCL for R-Chart (D4) for x-chart (A) 1.880 0 3.267 1.023 0 2.575 0.729 0 2.282 0.577 0 2.115 0.483 0 2.004 0.419 0.076 1.924 0.373 0.136 1.864 0.337 0.184 1.816 0.308 0.223 1.777 10Step by Step Solution
There are 3 Steps involved in it
1 Expert Approved Answer
Step: 1 Unlock

Question Has Been Solved by an Expert!
Get step-by-step solutions from verified subject matter experts
Step: 2 Unlock
Step: 3 Unlock