

Question: Help with these two from my chapter 16 assignment please Area in right tail Table VI t-Distribution Area in Right Tail df 0.25 0.20 0.15
Help with these two from my chapter 16 assignment please
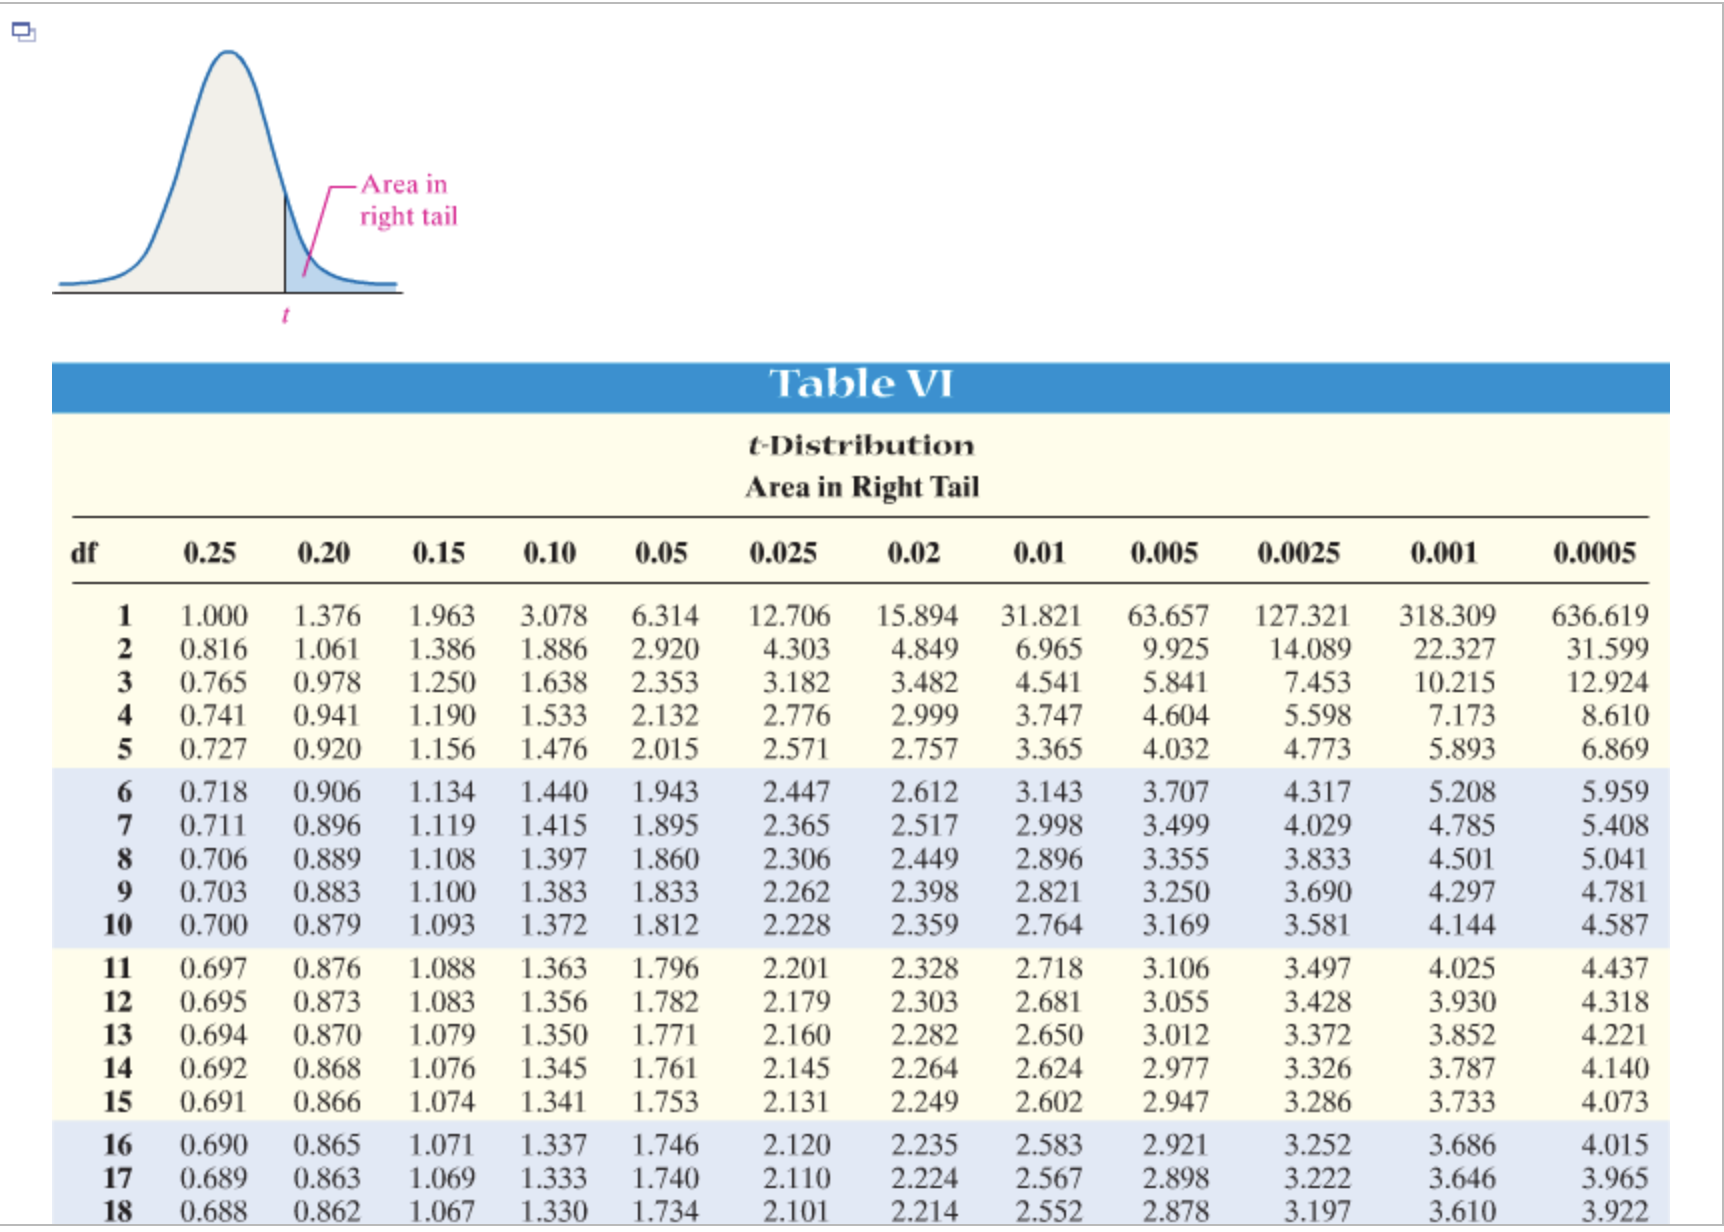
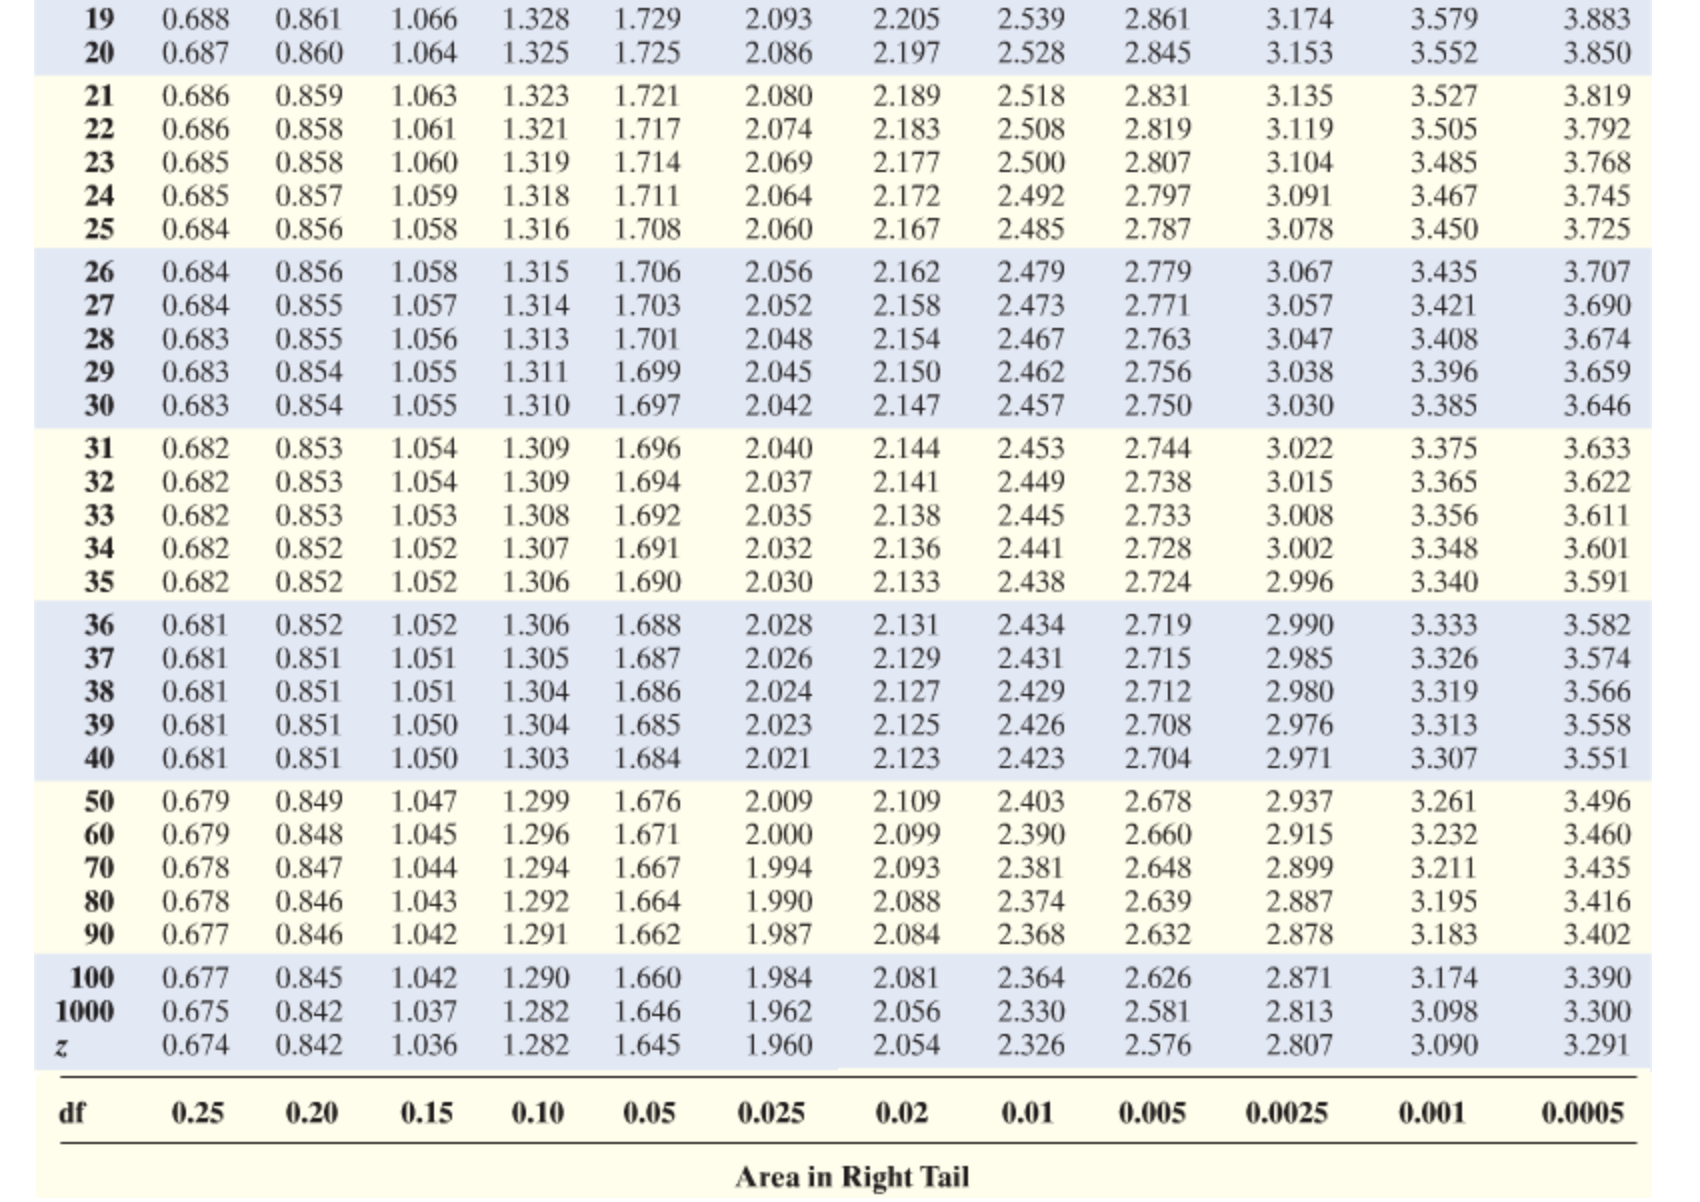
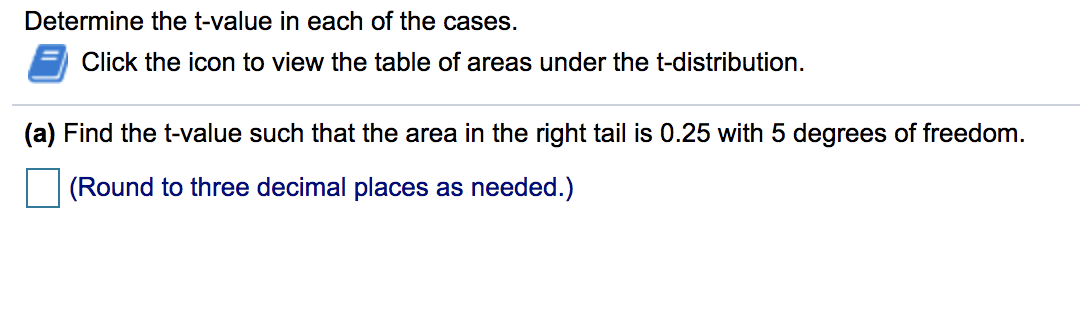
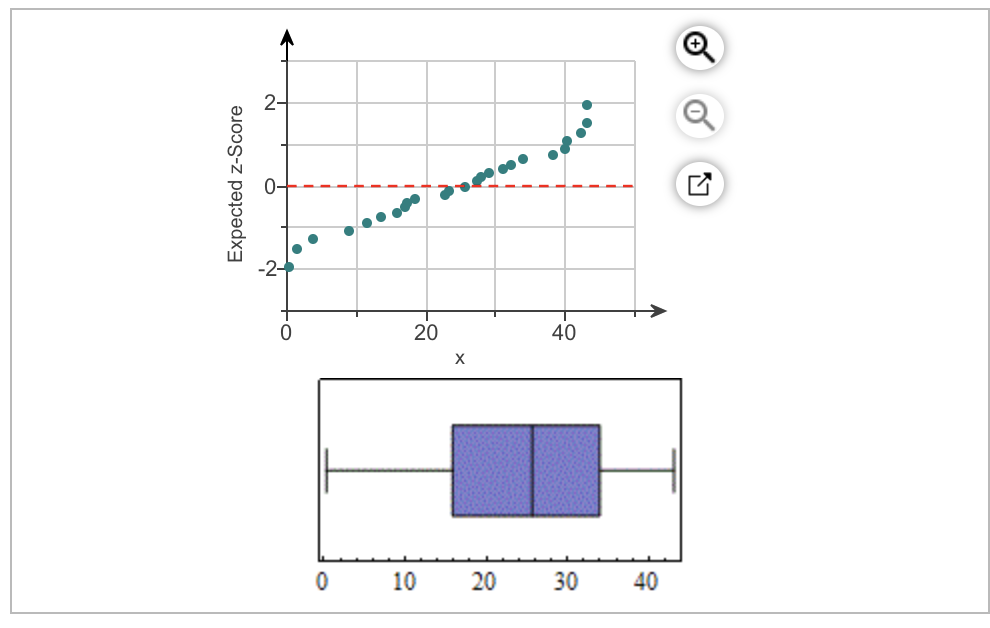
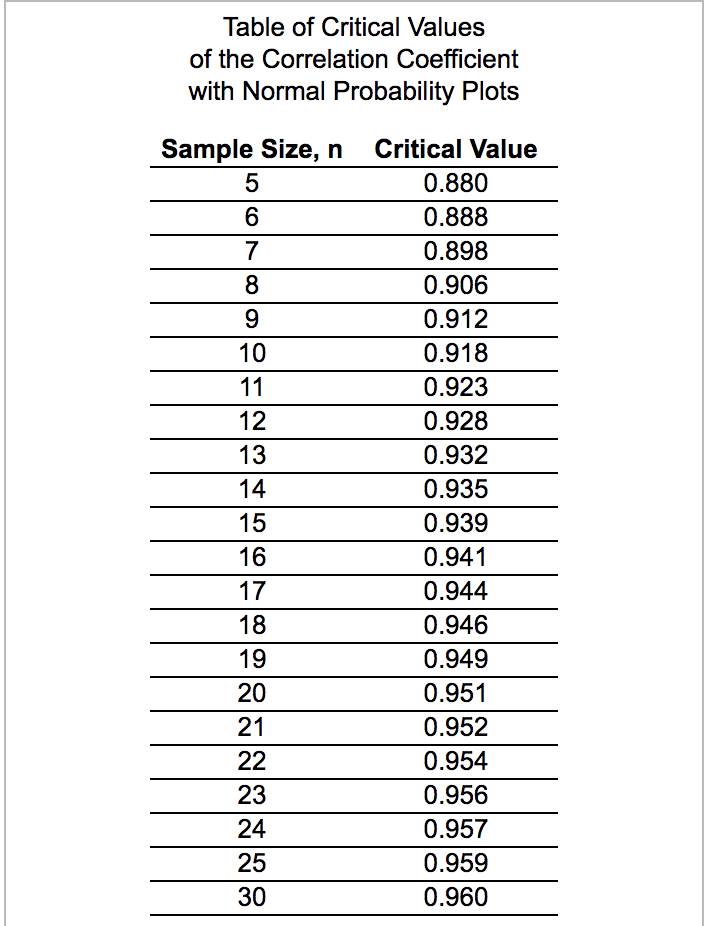
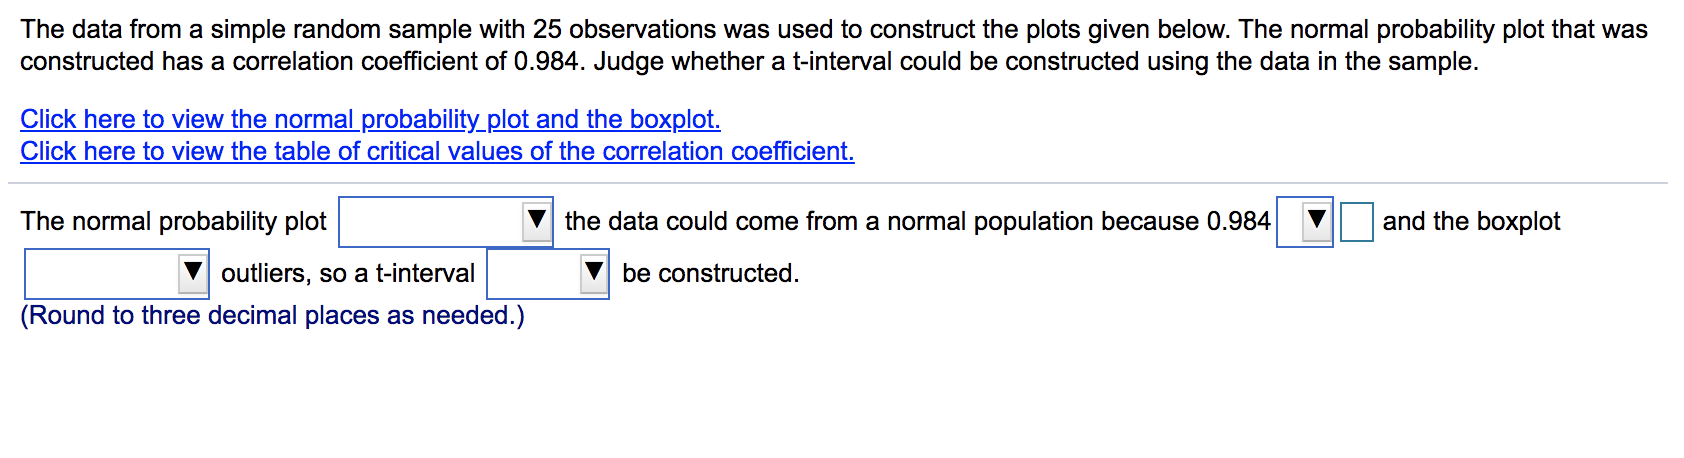
Area in right tail Table VI t-Distribution Area in Right Tail df 0.25 0.20 0.15 0.10 0.05 0.025 0.02 0.01 0.005 0.0025 0.001 0.0005 1.000 1.376 1.963 3.078 6.314 12.706 15.894 31.821 63.657 127.321 318.309 636.619 0.816 1.061 1.386 1.886 2.920 4.303 4.849 6.965 9.925 14.089 22.327 31.599 VIAWNE 0.765 0.978 1.250 1.638 2.353 3.182 3.482 4.541 5.841 7.453 10.215 12.924 0.741 0.941 1.190 1.533 2.132 2.776 2.999 3.747 4.604 5.598 7.173 8.610 0.727 0.920 1.156 1.476 2.015 2.571 2.757 3.365 4.032 4.773 5.893 6.869 6 0.718 0.906 1.134 1.440 1.943 2.447 2.612 3.143 3.707 4.317 5.208 5.959 7 0.711 0.896 1.119 1.415 1.895 2.365 2.517 2.998 3.499 4.029 4.785 5.408 8 0.706 0.889 1.108 1.397 1.860 2.306 2.449 2.896 3.355 9 3.833 4.501 5.041 0.703 0.883 1.100 1.383 1.833 2.262 2.398 2.821 3.250 3.690 4.297 4.781 10 0.700 0.879 1.093 1.372 1.812 2.228 2.359 2.764 3.169 3.581 4.144 4.587 11 0.697 0.876 1.088 1.363 1.796 2.201 2.328 2.718 3.106 3.497 4.025 4.437 12 0.695 0.873 1.083 1.356 1.782 2.179 2.303 2.681 3.055 3.428 3.930 4.318 13 0.694 0.870 1.079 1.350 1.771 2.160 2.282 2.650 3.012 3.372 3.852 4.221 14 0.692 0.868 1.076 1.345 1.761 2.145 2.264 2.624 2.977 3.326 3.787 4.140 15 0.691 0.866 1.074 1.341 1.753 2.131 2.249 2.602 2.947 3.286 3.733 4.073 16 0.690 0.865 1.071 1.337 1.746 2.120 2.235 2.583 2.921 3.252 3.686 17 4.015 0.689 0.863 1.069 1.333 1.740 2.110 2.224 2.567 2.898 3.222 3.646 3.965 18 0.688 0.862 1.067 1.330 1.734 2.101 2.214 2.552 2.878 3.197 3.610 3.922\fDetermine the t-value in each of the cases. a Click the icon to View the table of areas under the t-distributicn. (a) Find the t-value such that the area in the right tail is 0.25 with 5 degrees of freedom. |:| (Round to three decimal places as needed.) \fTable of Critical Values of the Correlation Coefficient with Normal Probability Plots Sample Size, n Critical Value 5 0.880 6 0.888 7 0.898 8 0.906 CO 0.912 10 0.918 11 0.923 12 0.928 13 0.932 14 0.935 15 0.939 16 0.941 17 0.944 18 0.946 19 0.949 20 0.951 21 0.952 22 0.954 23 0.956 24 0.957 25 0.959 30 0.960The data from a simple random sample with 25 observations was used to construct the plots given below. The normal probability plot that was constructed has a correlation coefficient of 0.984. Judge whether a t-interval could be constructed using the data in the sample. Click here to view the normal probability plot and the boxplot. Click here to view the table of critical values of the correlation coefficient. The normal probability plot the data could come from a normal population because 0.984 and the boxplot outliers, so a t-interval be constructed. (Round to three decimal places as needed.)
Step by Step Solution
There are 3 Steps involved in it

Get step-by-step solutions from verified subject matter experts