

Question: please help Area in right tail Table VI t-Distribution Area in Right Tail df 0.25 0.20 0.15 0.10 0.05 0.025 0.02 0.01 0.005 0.0025 0.001


please help
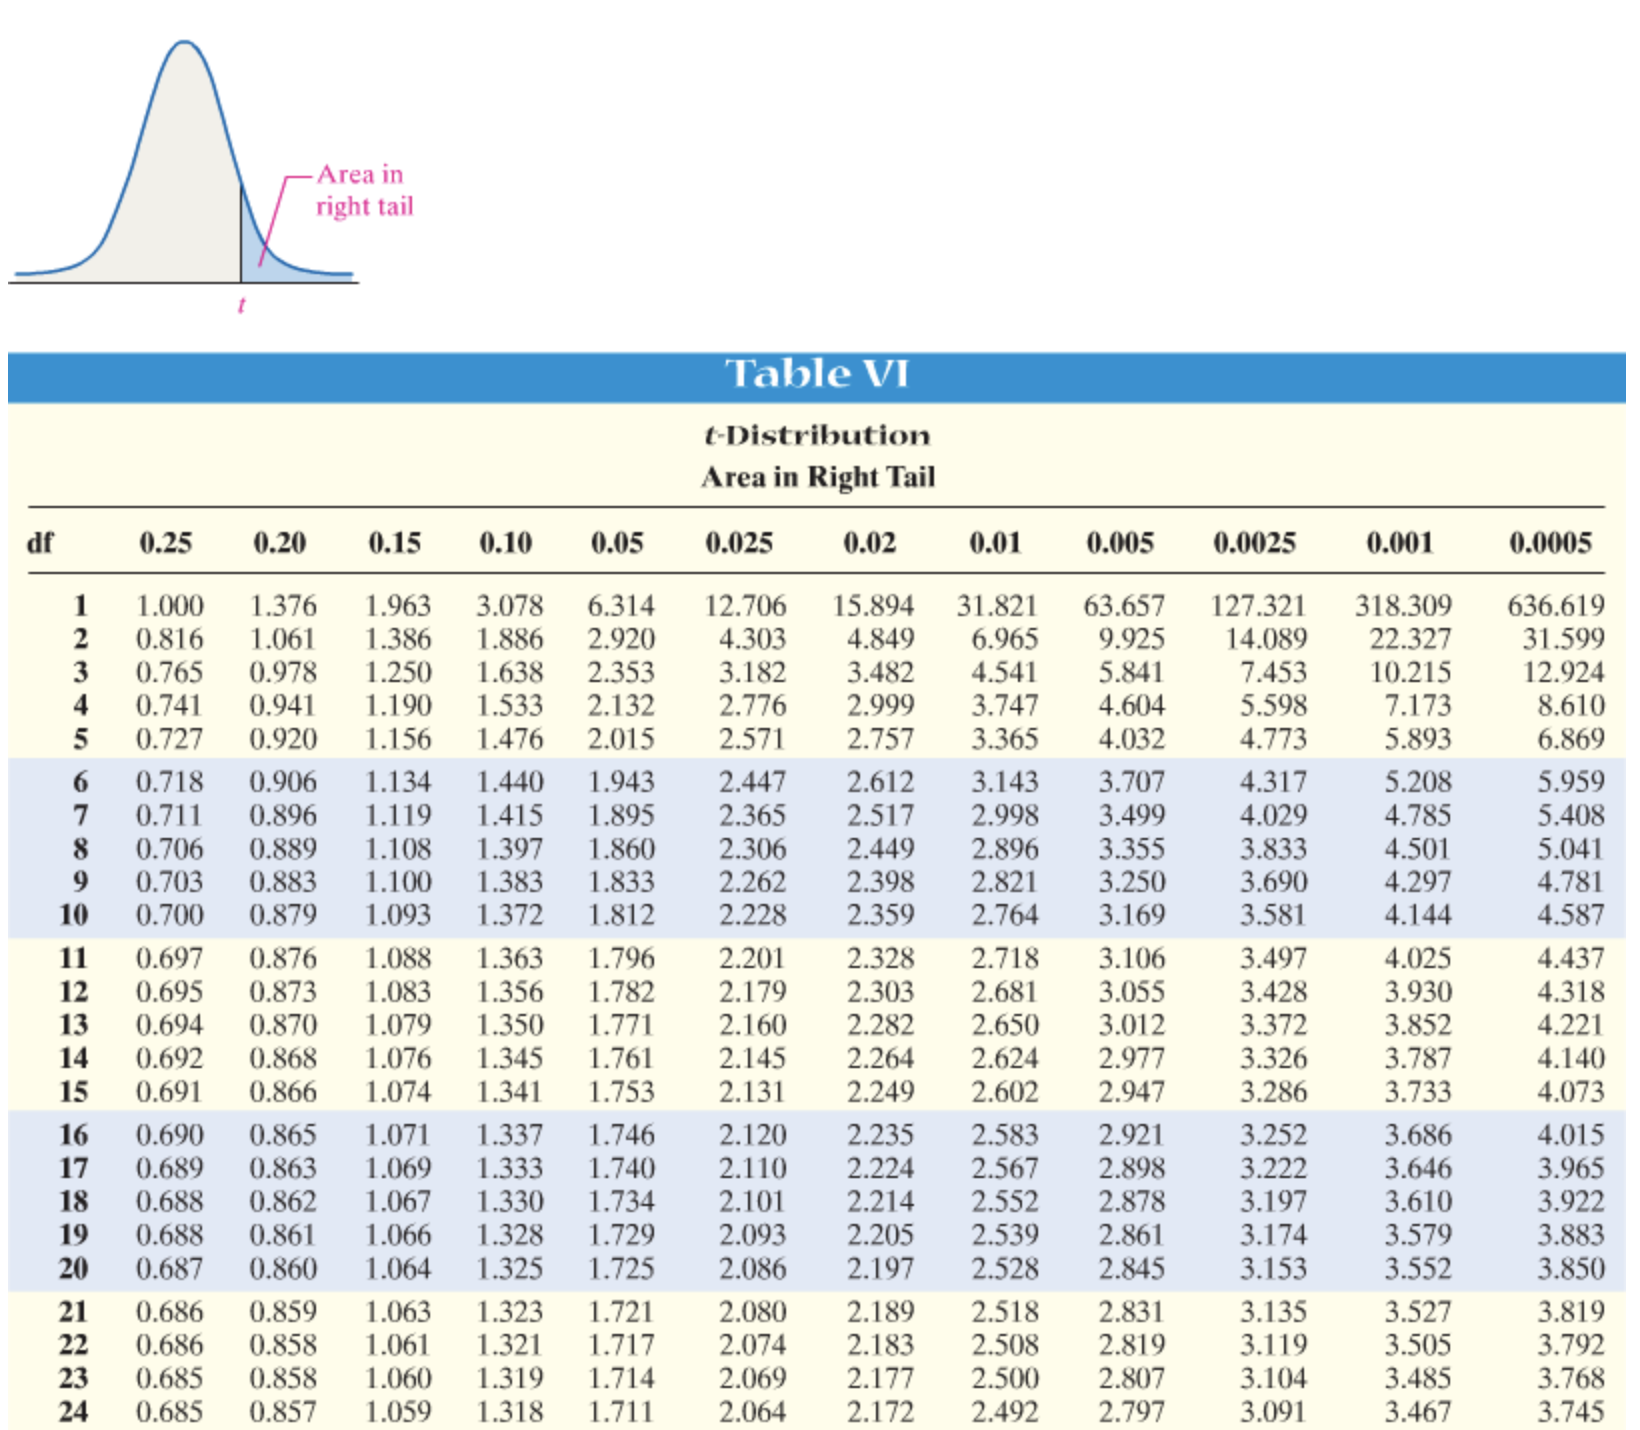

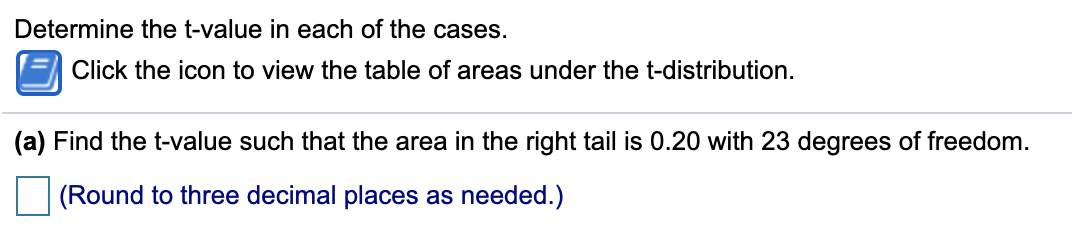

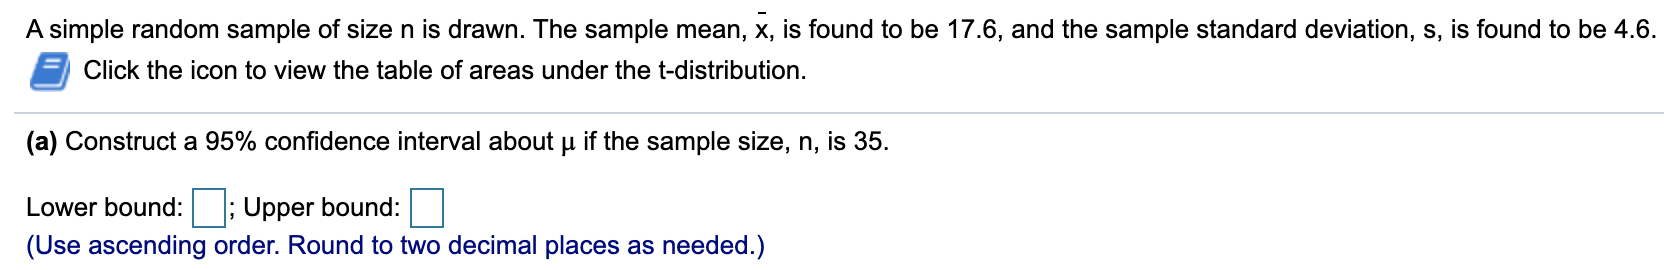
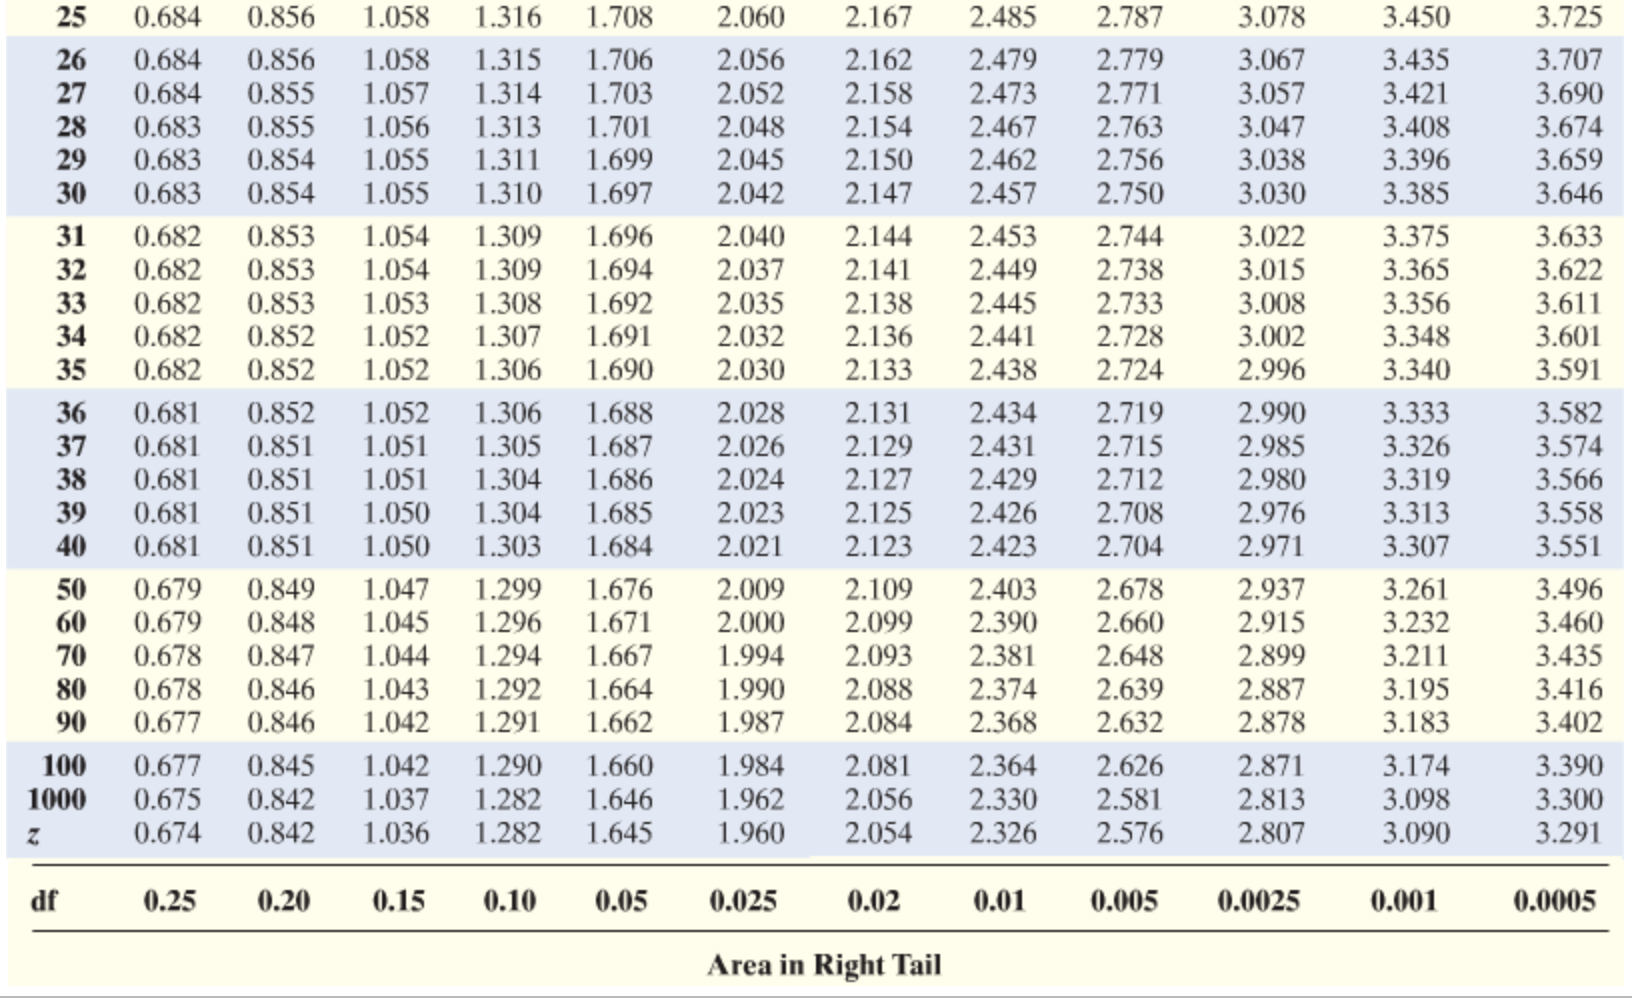
Area in right tail Table VI t-Distribution Area in Right Tail df 0.25 0.20 0.15 0.10 0.05 0.025 0.02 0.01 0.005 0.0025 0.001 0.0005 1.000 1.376 1.963 3.078 6.314 12.706 15.894 31.821 63.657 0.816 127.321 318.309 1.061 1.386 636.619 1.886 2.920 4.303 4.849 6.965 9.925 0.765 14.089 0.978 1.250 1.638 22.327 2.353 31.599 MAWNE 3.182 3.482 4.541 5.841 7.453 0.741 0.941 1.190 10.215 12.924 1.533 2.132 2.776 2.999 3.747 4.604 0.727 0.920 1.156 5.598 7.173 1.476 2.015 8.610 2.571 2.757 3.365 4.032 4.773 5.893 6.869 6 0.718 0.906 1.134 1.440 1.943 2.447 2.612 3.143 3.707 0.711 4.317 5.208 0.896 5.959 1.119 1.415 1.895 2.365 2.517 2.998 3.499 0.706 4.029 0.889 1.108 4.785 1.397 5.408 1.860 2.306 2.449 2.896 9 3.355 0.703 3.833 0.883 4.501 1.100 1.383 5.041 1.833 2.262 2.398 10 2.821 3.250 0.700 3.690 4.297 0.879 1.093 1.372 1.812 4.781 2.228 2.359 2.764 3.169 3.581 4.144 4.587 11 0.697 0.876 1.088 1.363 1.796 2.201 2.328 2.718 12 0.695 3.106 3.497 0.873 4.025 1.083 1.356 4.437 1.782 2.179 2.303 2.681 13 3.055 0.694 3.428 3.930 0.870 4.318 1.079 1.350 1.771 2.160 2.282 2.650 14 0.692 0.868 3.012 1.076 1.345 3.372 3.852 1.761 4.221 2.145 2.264 2.624 2.977 15 0.691 3.326 3.787 0.866 1.074 4.140 1.341 1.753 2.131 2.249 2.602 2.947 3.286 3.733 4.073 16 0.690 0.865 1.071 1.337 1.746 2.120 2.235 2.583 2.921 17 0.689 0.863 3.252 3.686 1.069 1.333 4.015 1.740 2.110 2.224 2.567 2.898 18 0.688 3.222 0.862 3.646 1.067 3.965 1.330 1.734 2.101 2.214 2.552 19 2.878 0.688 3.197 0.861 3.610 1.066 3.922 1.328 1.729 2.093 2.205 2.539 20 2.861 0.687 0.860 3.174 1.064 1.325 3.579 1.725 3.883 2.086 2.197 2.528 2.845 3.153 3.552 3.850 21 0.686 0.859 1.063 1.323 1.721 2.080 2.189 2.518 22 2.831 3.135 0.686 0.858 3.527 3.819 1.061 1.321 1.717 2.074 2.183 2.508 23 2.819 0.685 3.119 0.858 3.505 1.060 1.319 1.714 3.792 2.069 24 2.177 2.500 2.807 0.685 3.104 0.857 3.485 1.059 1.318 1.711 3.768 2.064 2.172 2.492 2.797 3.091 3.467 3.74525 0.684 0.856 1.058 1.316 1.708 2.060 2.167 2.485 2.787 3.078 3.450 3.725 26 0.684 0.856 1.058 1.315 1.706 2.056 2.162 2.479 2.779 3.067 3.435 27 3.707 0.684 0.855 1.057 1.314 1.703 2.052 2.158 2.473 2.771 3.057 3.421 3.690 28 0.683 0.855 1.056 1.313 1.701 2.048 2.154 2.467 2.763 3.047 3.408 29 0.683 3.674 0.854 1.055 1.311 1.699 2.045 2.150 2.462 2.756 3.038 3.396 3.659 30 0.683 0.854 1.055 1.310 1.697 2.042 2.147 2.457 2.750 3.030 3.385 3.646 31 0.682 0.853 1.054 1.309 1.696 2.040 2.144 2.453 2.744 3.022 3.375 32 0.682 3.633 0.853 1.054 1.309 1.694 2.037 2.141 2.449 2.738 3.015 3.365 3.622 33 0.682 0.853 1.053 1.308 1.692 2.035 2.138 2.445 2.733 3.008 3.356 34 0.682 3.611 0.852 1.052 1.307 1.691 2.032 2.136 2.441 2.728 3.002 3.348 35 3.601 0.682 0.852 1.052 1.306 1.690 2.030 2.133 2.438 2.724 2.996 3.340 3.591 36 0.681 0.852 1.052 1.306 1.688 2.028 2.131 2.434 2.719 2.990 3.333 37 3.582 0.681 0.851 1.051 1.305 1.687 2.026 2.129 2.431 2.715 2.985 38 3.326 0.681 0.851 3.574 1.051 1.304 1.686 2.024 2.127 2.429 2.712 2.980 3.319 3.566 39 0.681 0.851 1.050 1.304 1.685 2.023 2.125 2.426 2.708 2.976 3.313 40 3.558 0.681 0.851 1.050 1.303 1.684 2.021 2.123 2.423 2.704 2.971 3.307 3.551 50 0.679 0.849 1.047 1.299 1.676 2.009 2.109 2.403 2.678 2.937 3.261 60 0.679 3.496 0.848 1.045 1.296 1.671 2.000 2.099 2.390 2.660 2.915 3.232 3.460 70 0.678 0.847 1.044 1.294 1.667 1.994 2.093 2.381 2.648 2.899 3.211 80 0.678 3.435 0.846 1.043 1.292 1.664 1.990 2.088 2.374 2.639 2.887 3.195 90 3.416 0.677 0.846 1.042 1.291 1.662 1.987 2.084 2.368 2.632 2.878 3.183 3.402 100 0.677 0.845 1.042 1.290 1.660 1.984 2.081 2.364 2.626 2.871 3.174 1000 3.390 0.675 0.842 1.037 1.282 1.646 1.962 2.056 2.330 2.581 2.813 3.098 3.300 2 0.674 0.842 1.036 1.282 1.645 1.960 2.054 2.326 2.576 2.807 3.090 3.291 df 0.25 0.20 0.15 0.10 0.05 0.025 0.02 0.01 0.005 0.0025 0.001 0.0005 Area in Right TailDetermine the t-value in each of the cases. 5 Click the icon to View the table of areas under the t-distribution. (a) Find the t-value such that the area in the right tail is 0.20 with 23 degrees of freedom. |:| (Round to three decimal places as needed.) A simple random sample of size n is drawn from a population that is normally distributed. The sample mean, x, is found to be 111, and the sample standard deviation, s, is found to be 10. (a) Construct an 80% confidence interval about u if the sample size, n, is 11. (b) Construct an 80% confidence interval about u if the sample size, n, is 29. (c) Construct a 95% confidence interval about u if the sample size, n, is 11. d) Could we have computed the confidence intervals in parts (a)-(c) if the population had not been normally distributed?Asimple random sample of size n is drawn. The sample mean, i, is found to be 17.6, and the sample standard deviation, 5, is found to be 4.6. 3 Click the icon to view the table of areas under the tdistribution. (a) Construct a 95% condence interval about u if the sample size, n, is 35. Lower bound: D; Upper bound: |:| (Use ascending order. Round to two decimal places as needed.)
Step by Step Solution
There are 3 Steps involved in it

Get step-by-step solutions from verified subject matter experts