

Question: help with this matlab problem asap thank you.... Exercise 2: Fourier Transform properties (a) Time Scaling. Create an M-file and: 1. Plot the waveform s(t)sinc(at/0.5)
help with this matlab problem asap thank you....
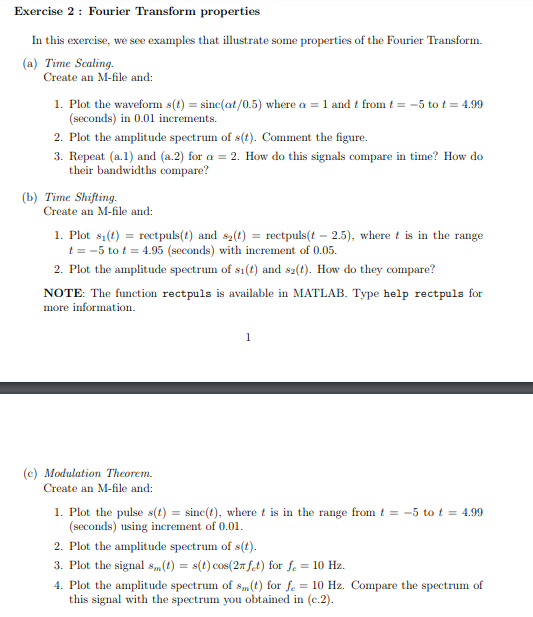
Exercise 2: Fourier Transform properties (a) Time Scaling. Create an M-file and: 1. Plot the waveform s(t)sinc(at/0.5) where a1 and t fro5 tot4.99 (seconds) in 0.01 increments. 2. Plot the amplitude spectrum of s(t). Comment the figure. 3. Repeat (a.1) and (a.2) for -2. How do this signals compare in tune? How do their bandwidths compare? (b) Time Shifting. Create an M-file and: 1. Plot s(t)rectpuls(t) and s2(t)rectpuls(t 2.5), where t is in the range t =-5 to t = 4.95 (seconds) with increment of 0.05. 2. Plot the amplitude spectrum of si() and s2(t). How do they compare? NOTE: The function rectpuls is available in MATLAB. Type help rectpuls for more information (e) Modulation Theorem Create an M-file and: I. Plot the pulse s(t) = sinc(t), where t is in the range fron t =-5 to t = 4.99 (seconds) using incremnt of 0.01 2. Plot the amplitude spectrum of s(t) 3. Plot the signal sm(t) s(tcos(2m Jet) for fe-10 Hz 4. Plot the amplitude spectrum of sm(t) for fe = 10 Hz. Compare the spectrum of this signal with the spectrum you obtained in (c.2)
Step by Step Solution
There are 3 Steps involved in it

Get step-by-step solutions from verified subject matter experts