

Question: Help with this question MC Price ATC QA Quantity Quantity (c) NC Price MC ATC MR Quantity REFER TO FIGURE 16-3. Which of the graphs
Help with this question
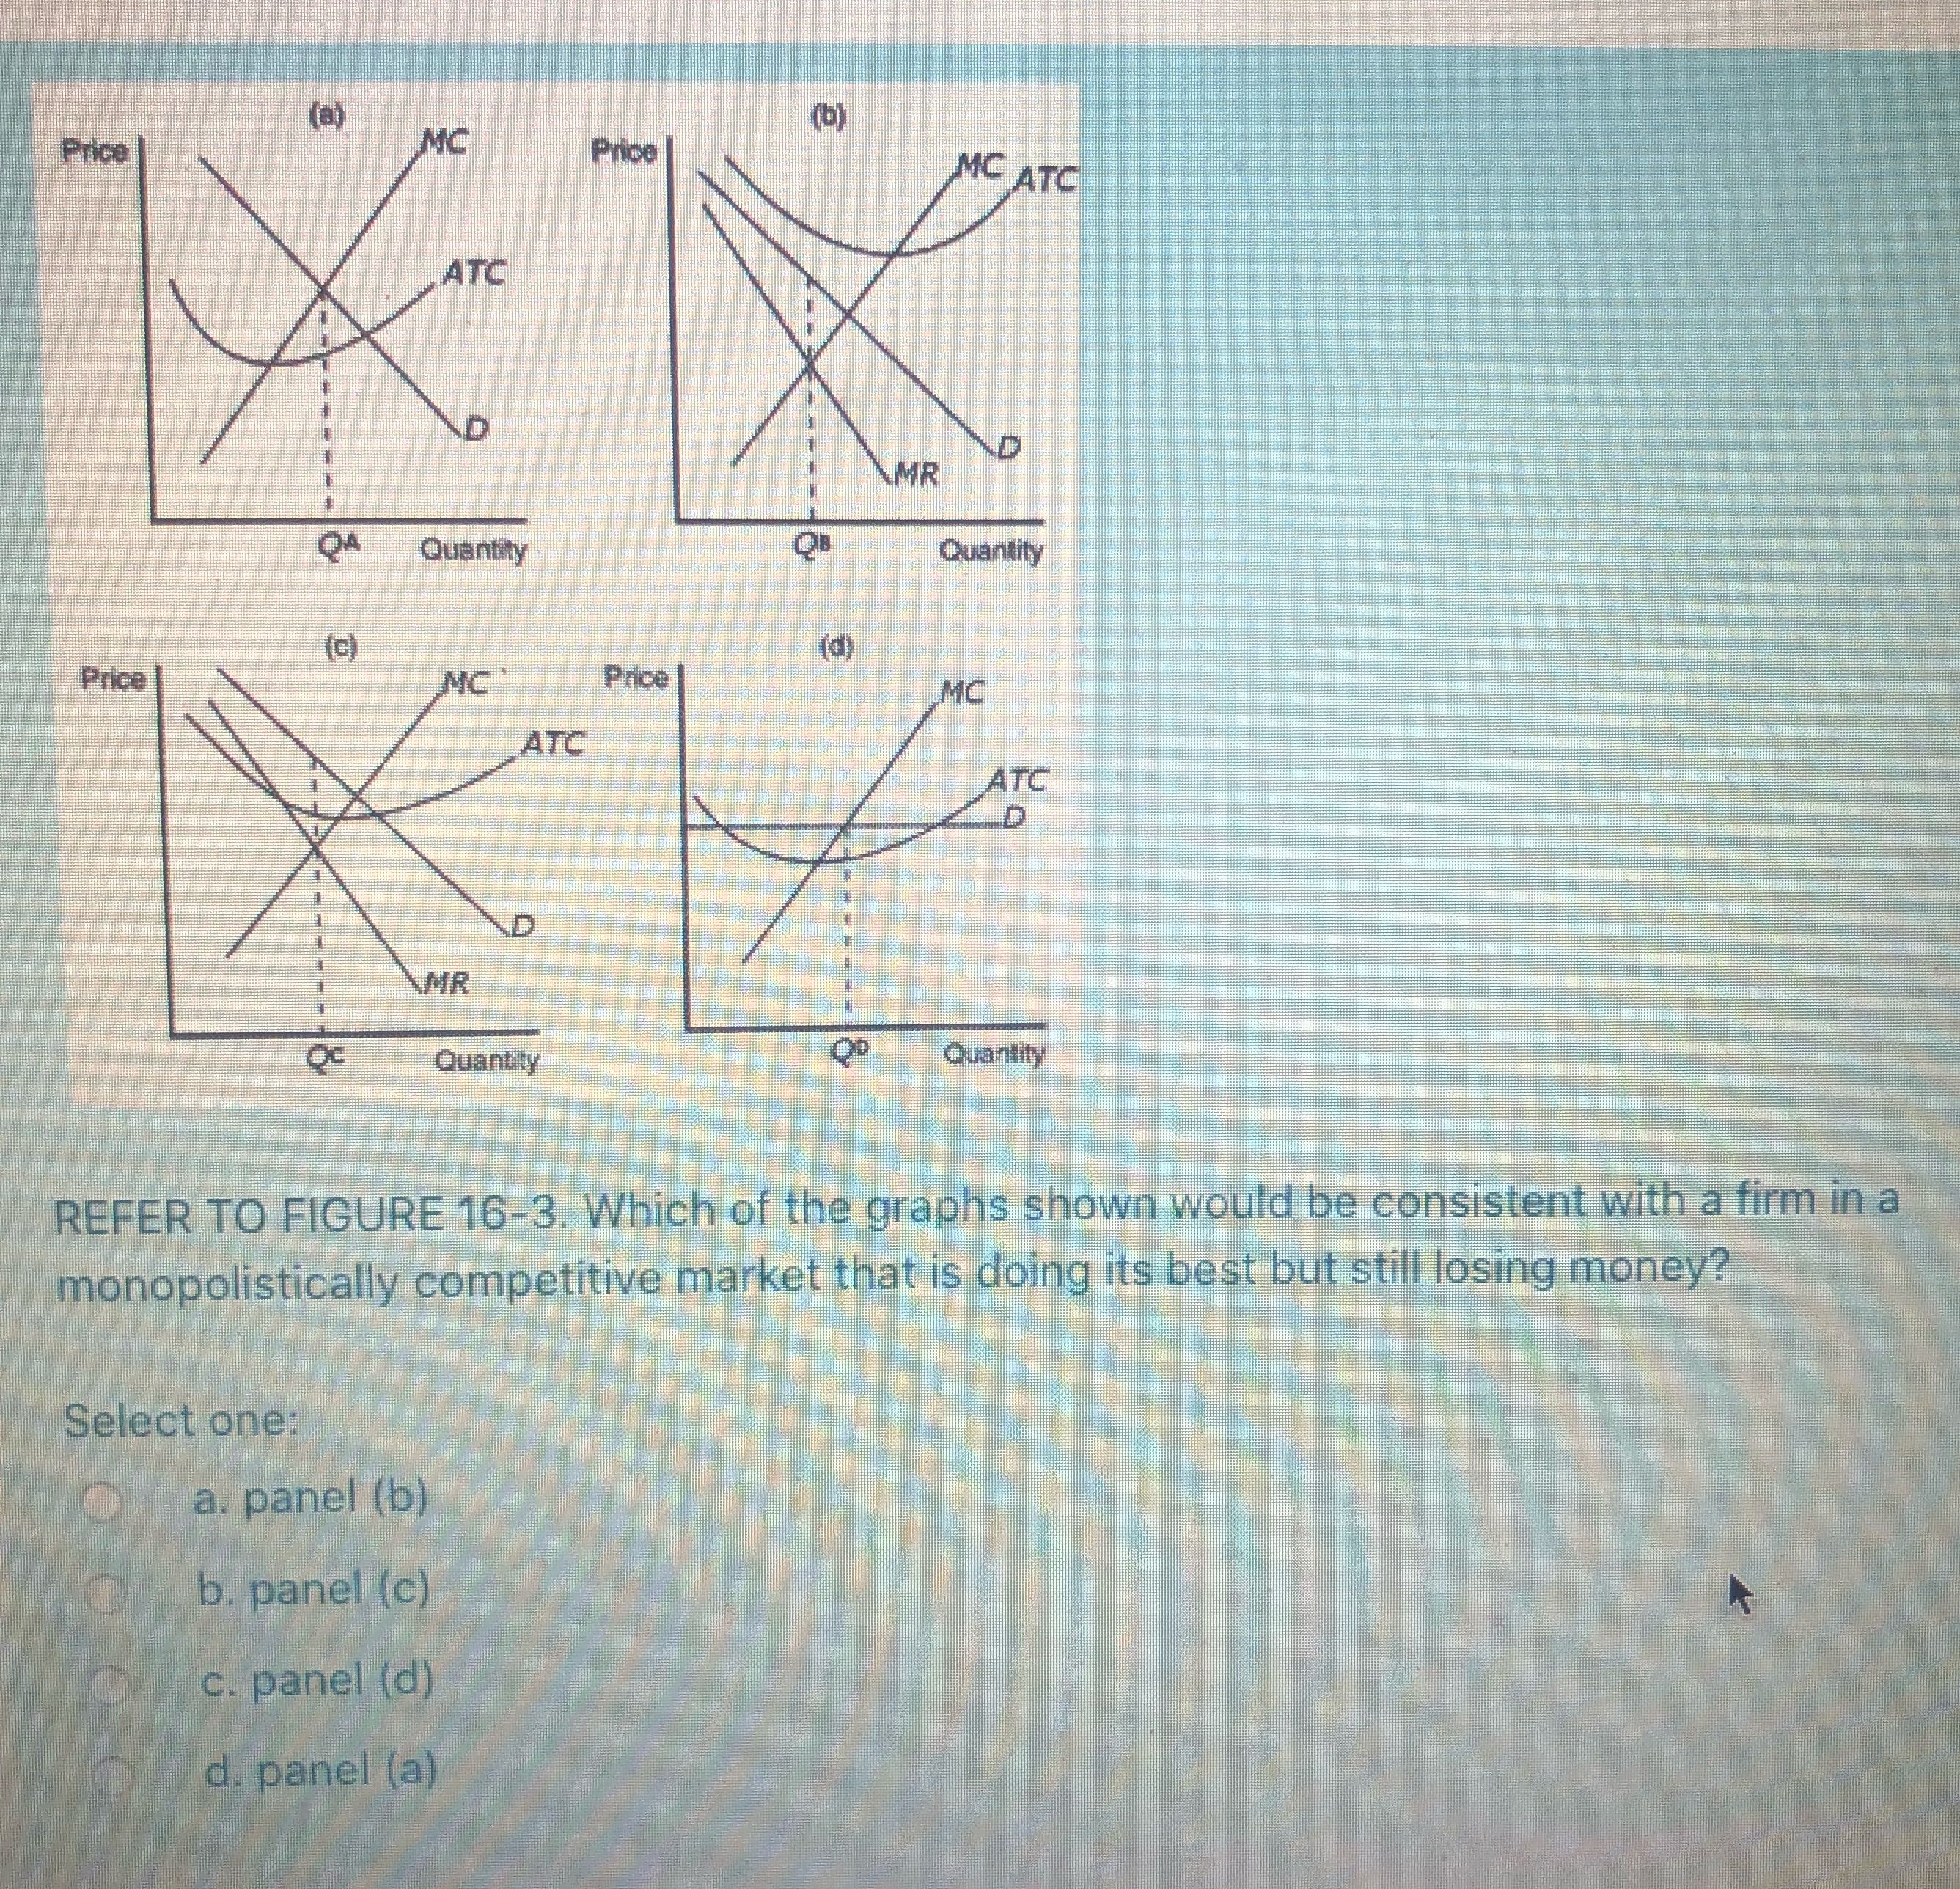
MC Price ATC QA Quantity Quantity (c) NC Price MC ATC MR Quantity REFER TO FIGURE 16-3. Which of the graphs shown would be consistent with a firm in a monopolistically competitive market ket that is doing its best but still losing sing money? Select one: a. panel (b) b. panel (c) c. panel (d) d. panel (a)
Step by Step Solution
There are 3 Steps involved in it
1 Expert Approved Answer
Step: 1 Unlock

Question Has Been Solved by an Expert!
Get step-by-step solutions from verified subject matter experts
Step: 2 Unlock
Step: 3 Unlock